Overview
The Company Dashboard allows for multiple individual accounts to be housed under a single Company Account. As a company admin, you'll have access to different company settings, overrides, and users.
Among these settings, you'll have access to set up and manage the reporting and analytics dashboard to pull reports for your LO teams including the following:
- Applications started
- Application completed rate
- Loan flows created
- Prospects by lead source
- Borrower demographics
- Median time for loans to close
- Mortgage pull-through rate
- Disclosures Sent
- Disclosures Completed
- Median start to submit time
- Median submit to conversion time
- Prospects by co-branded landing pages
- Documents uploaded
- Documents accepted
- Documents rejected
- Loans by creation source
How to Set Up
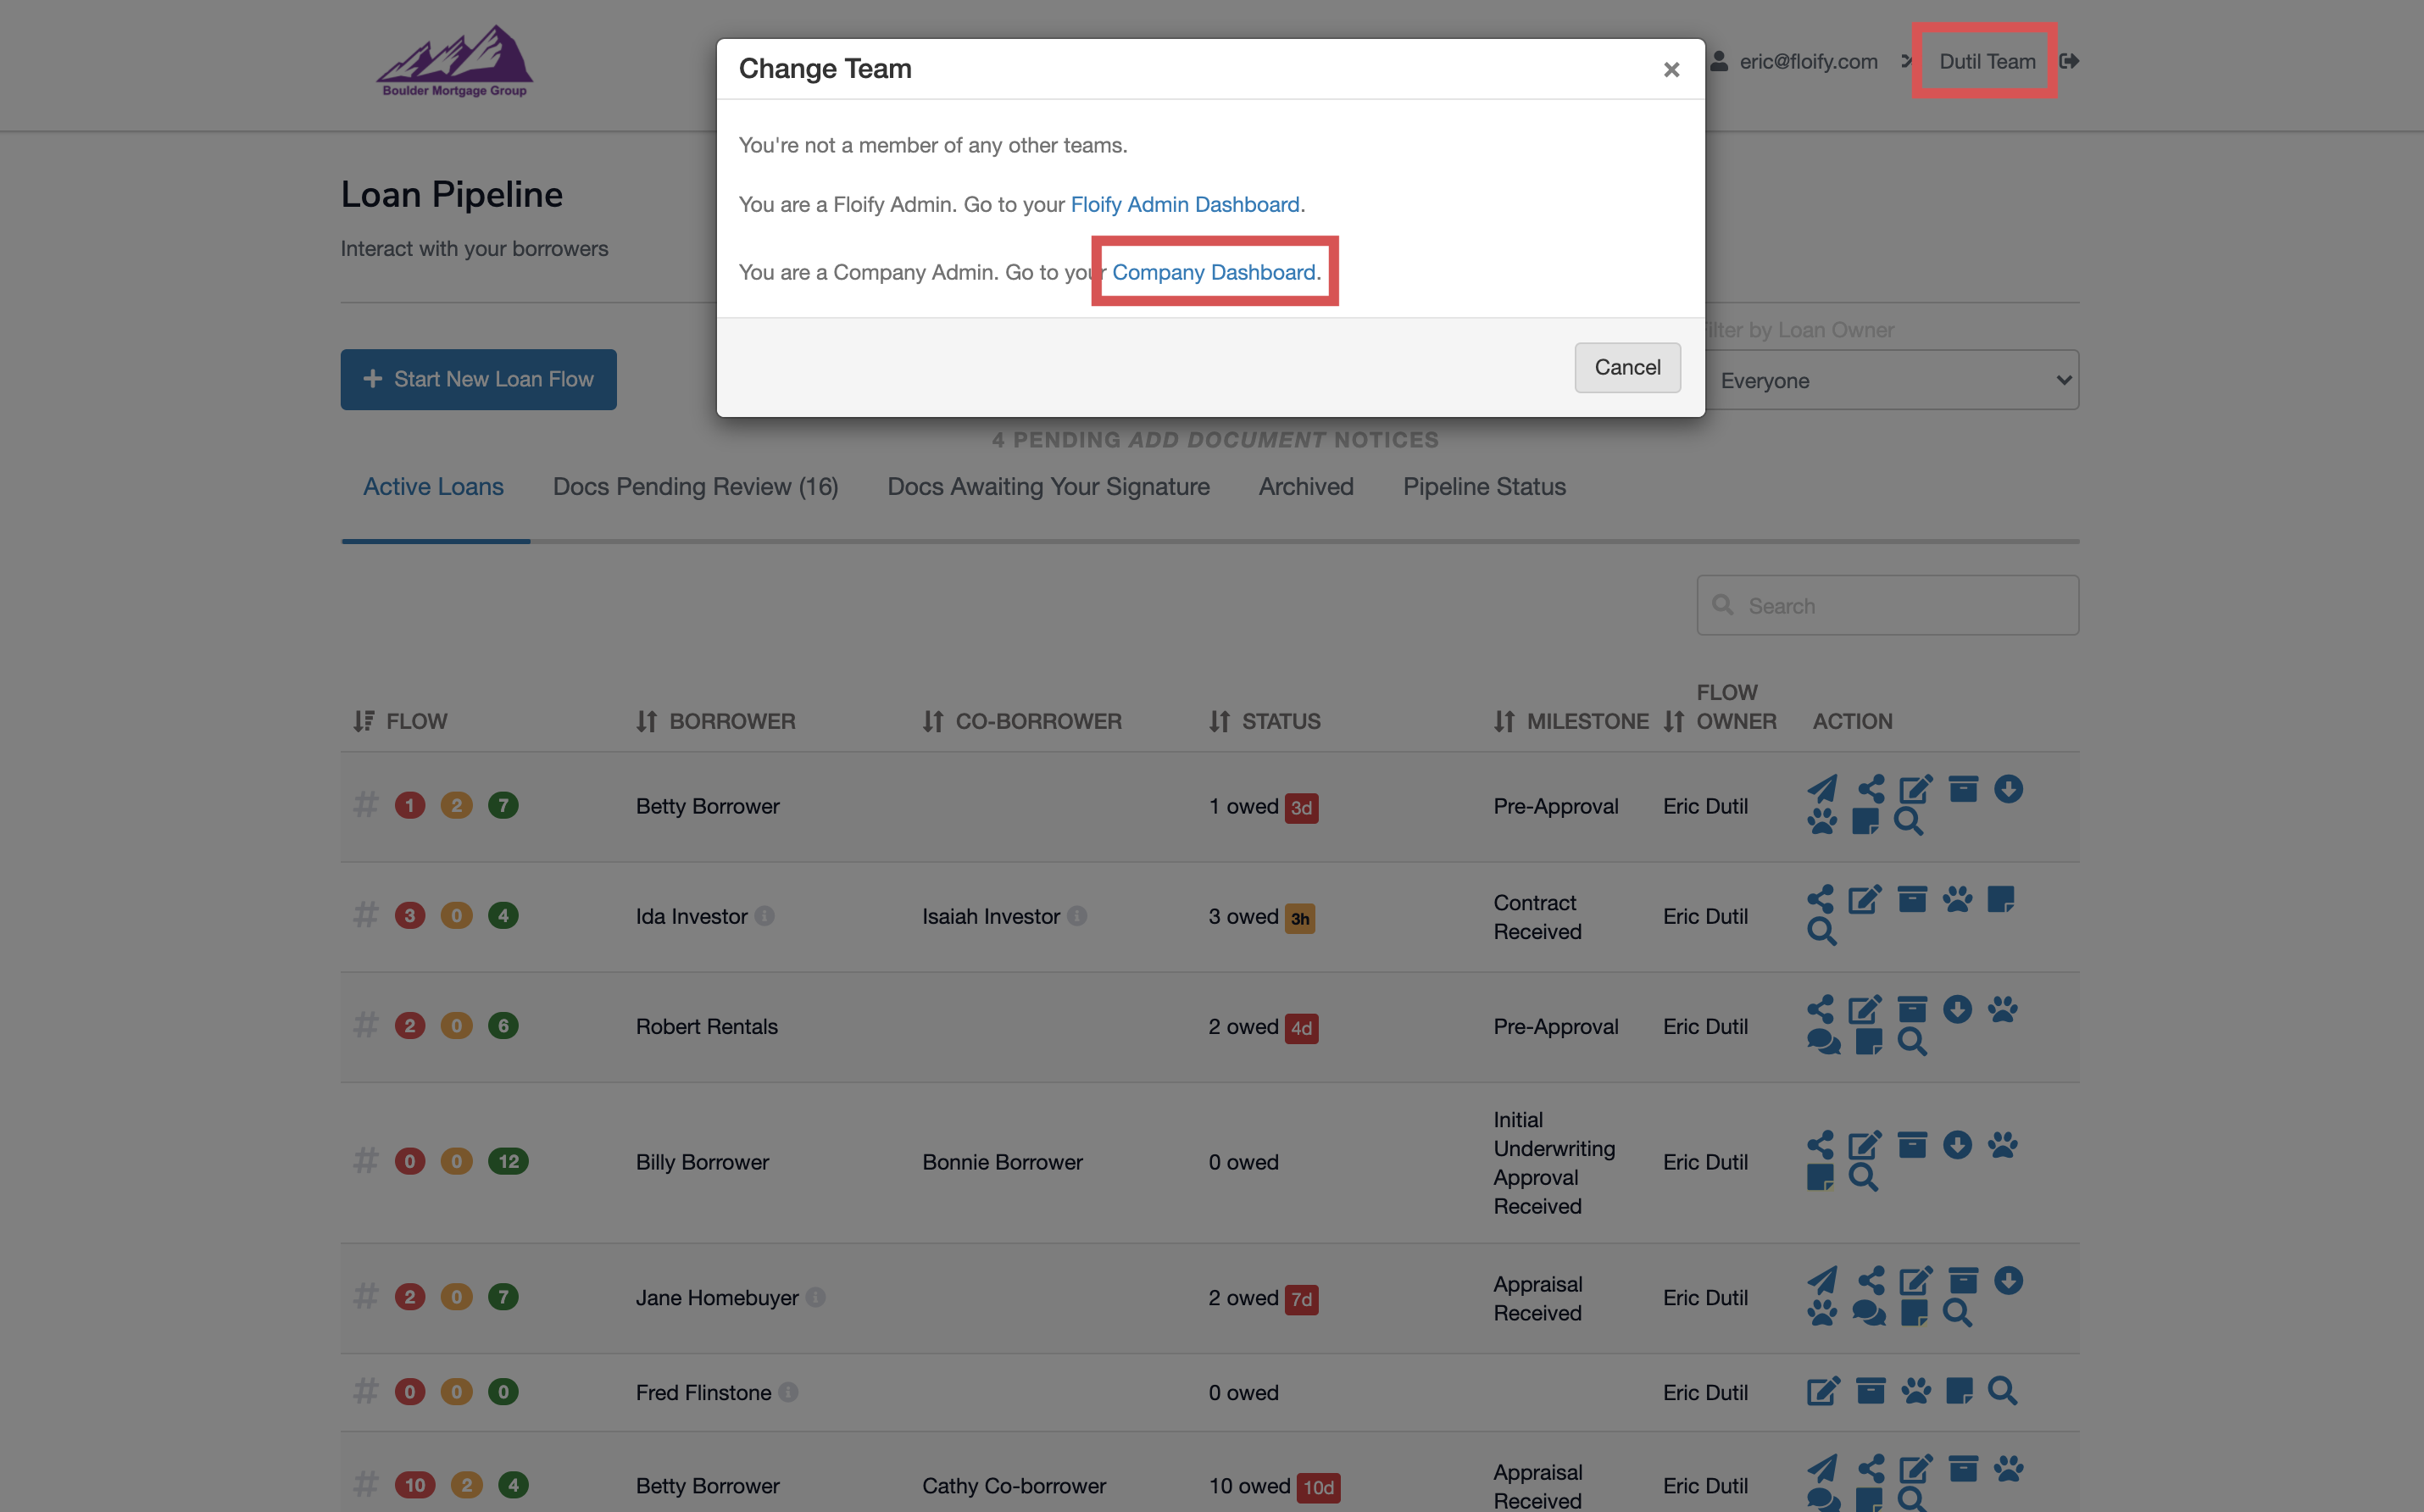
From the team pipeline, choose the team name in the upper right-hand corner and select the option to navigate to the Company Dashboard:
Navigate to Company Settings and then Reporting & Analytics:

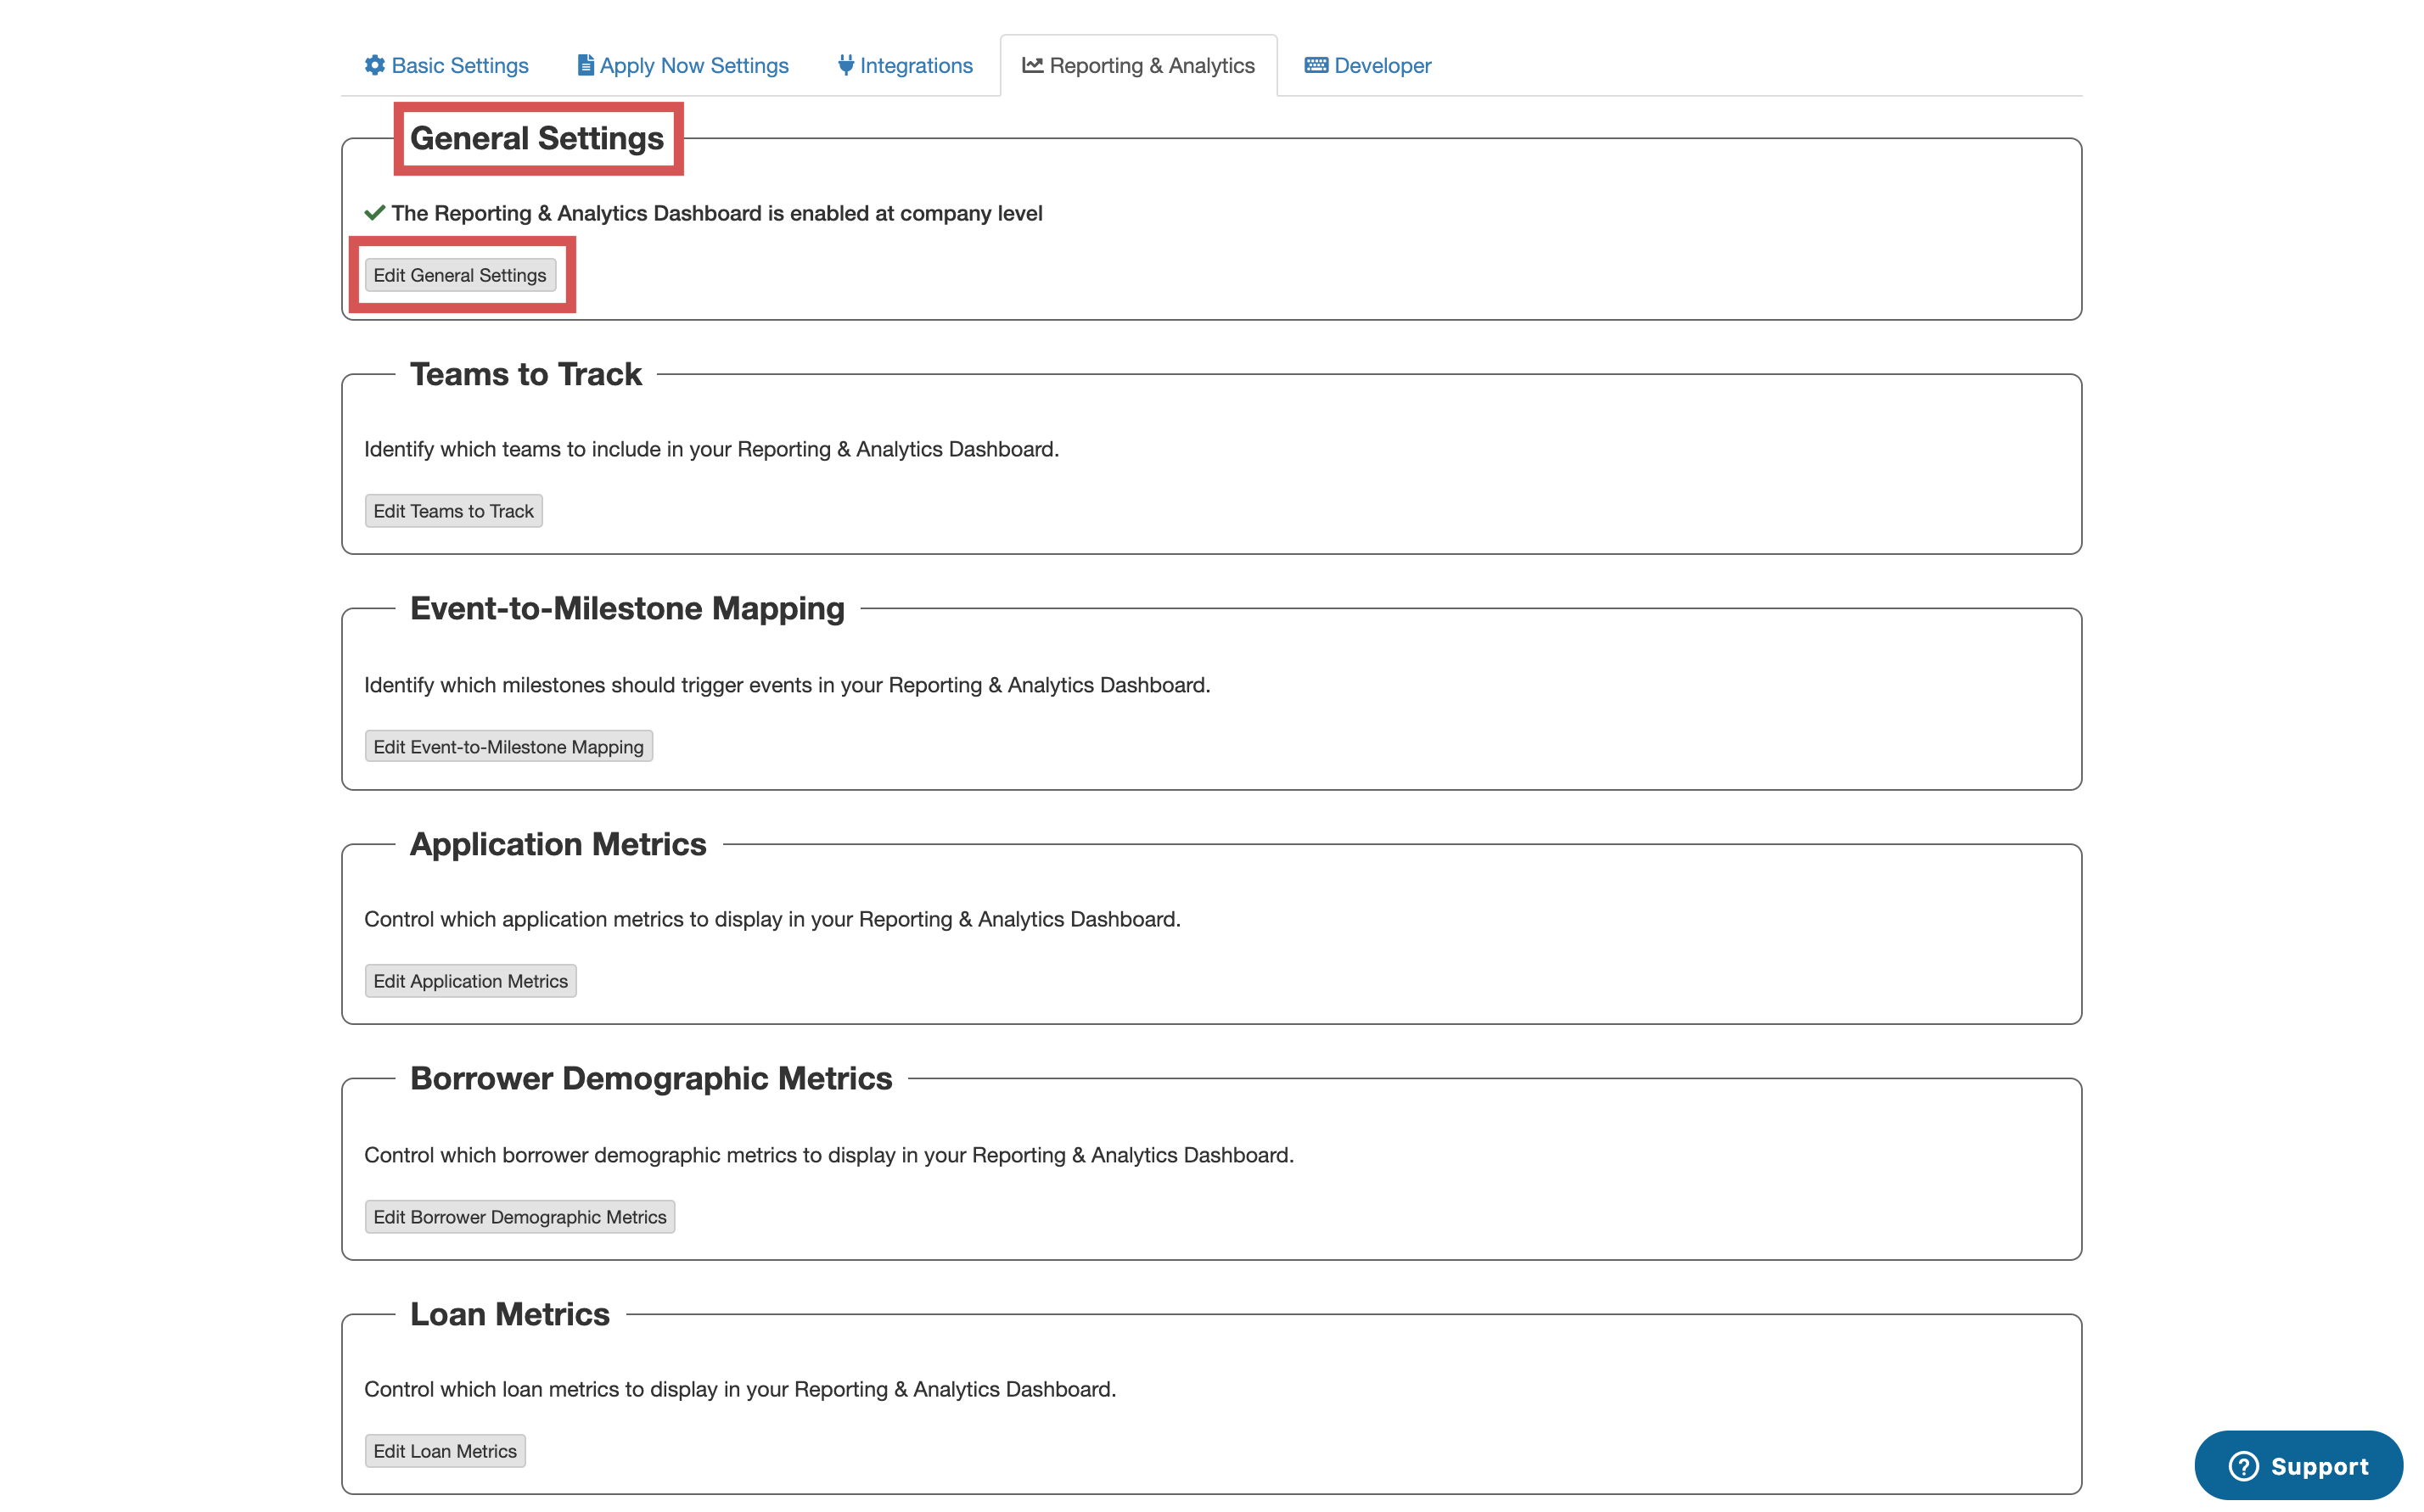
To enable the dashboard, select General Settings and then the option to Edit General Settings:
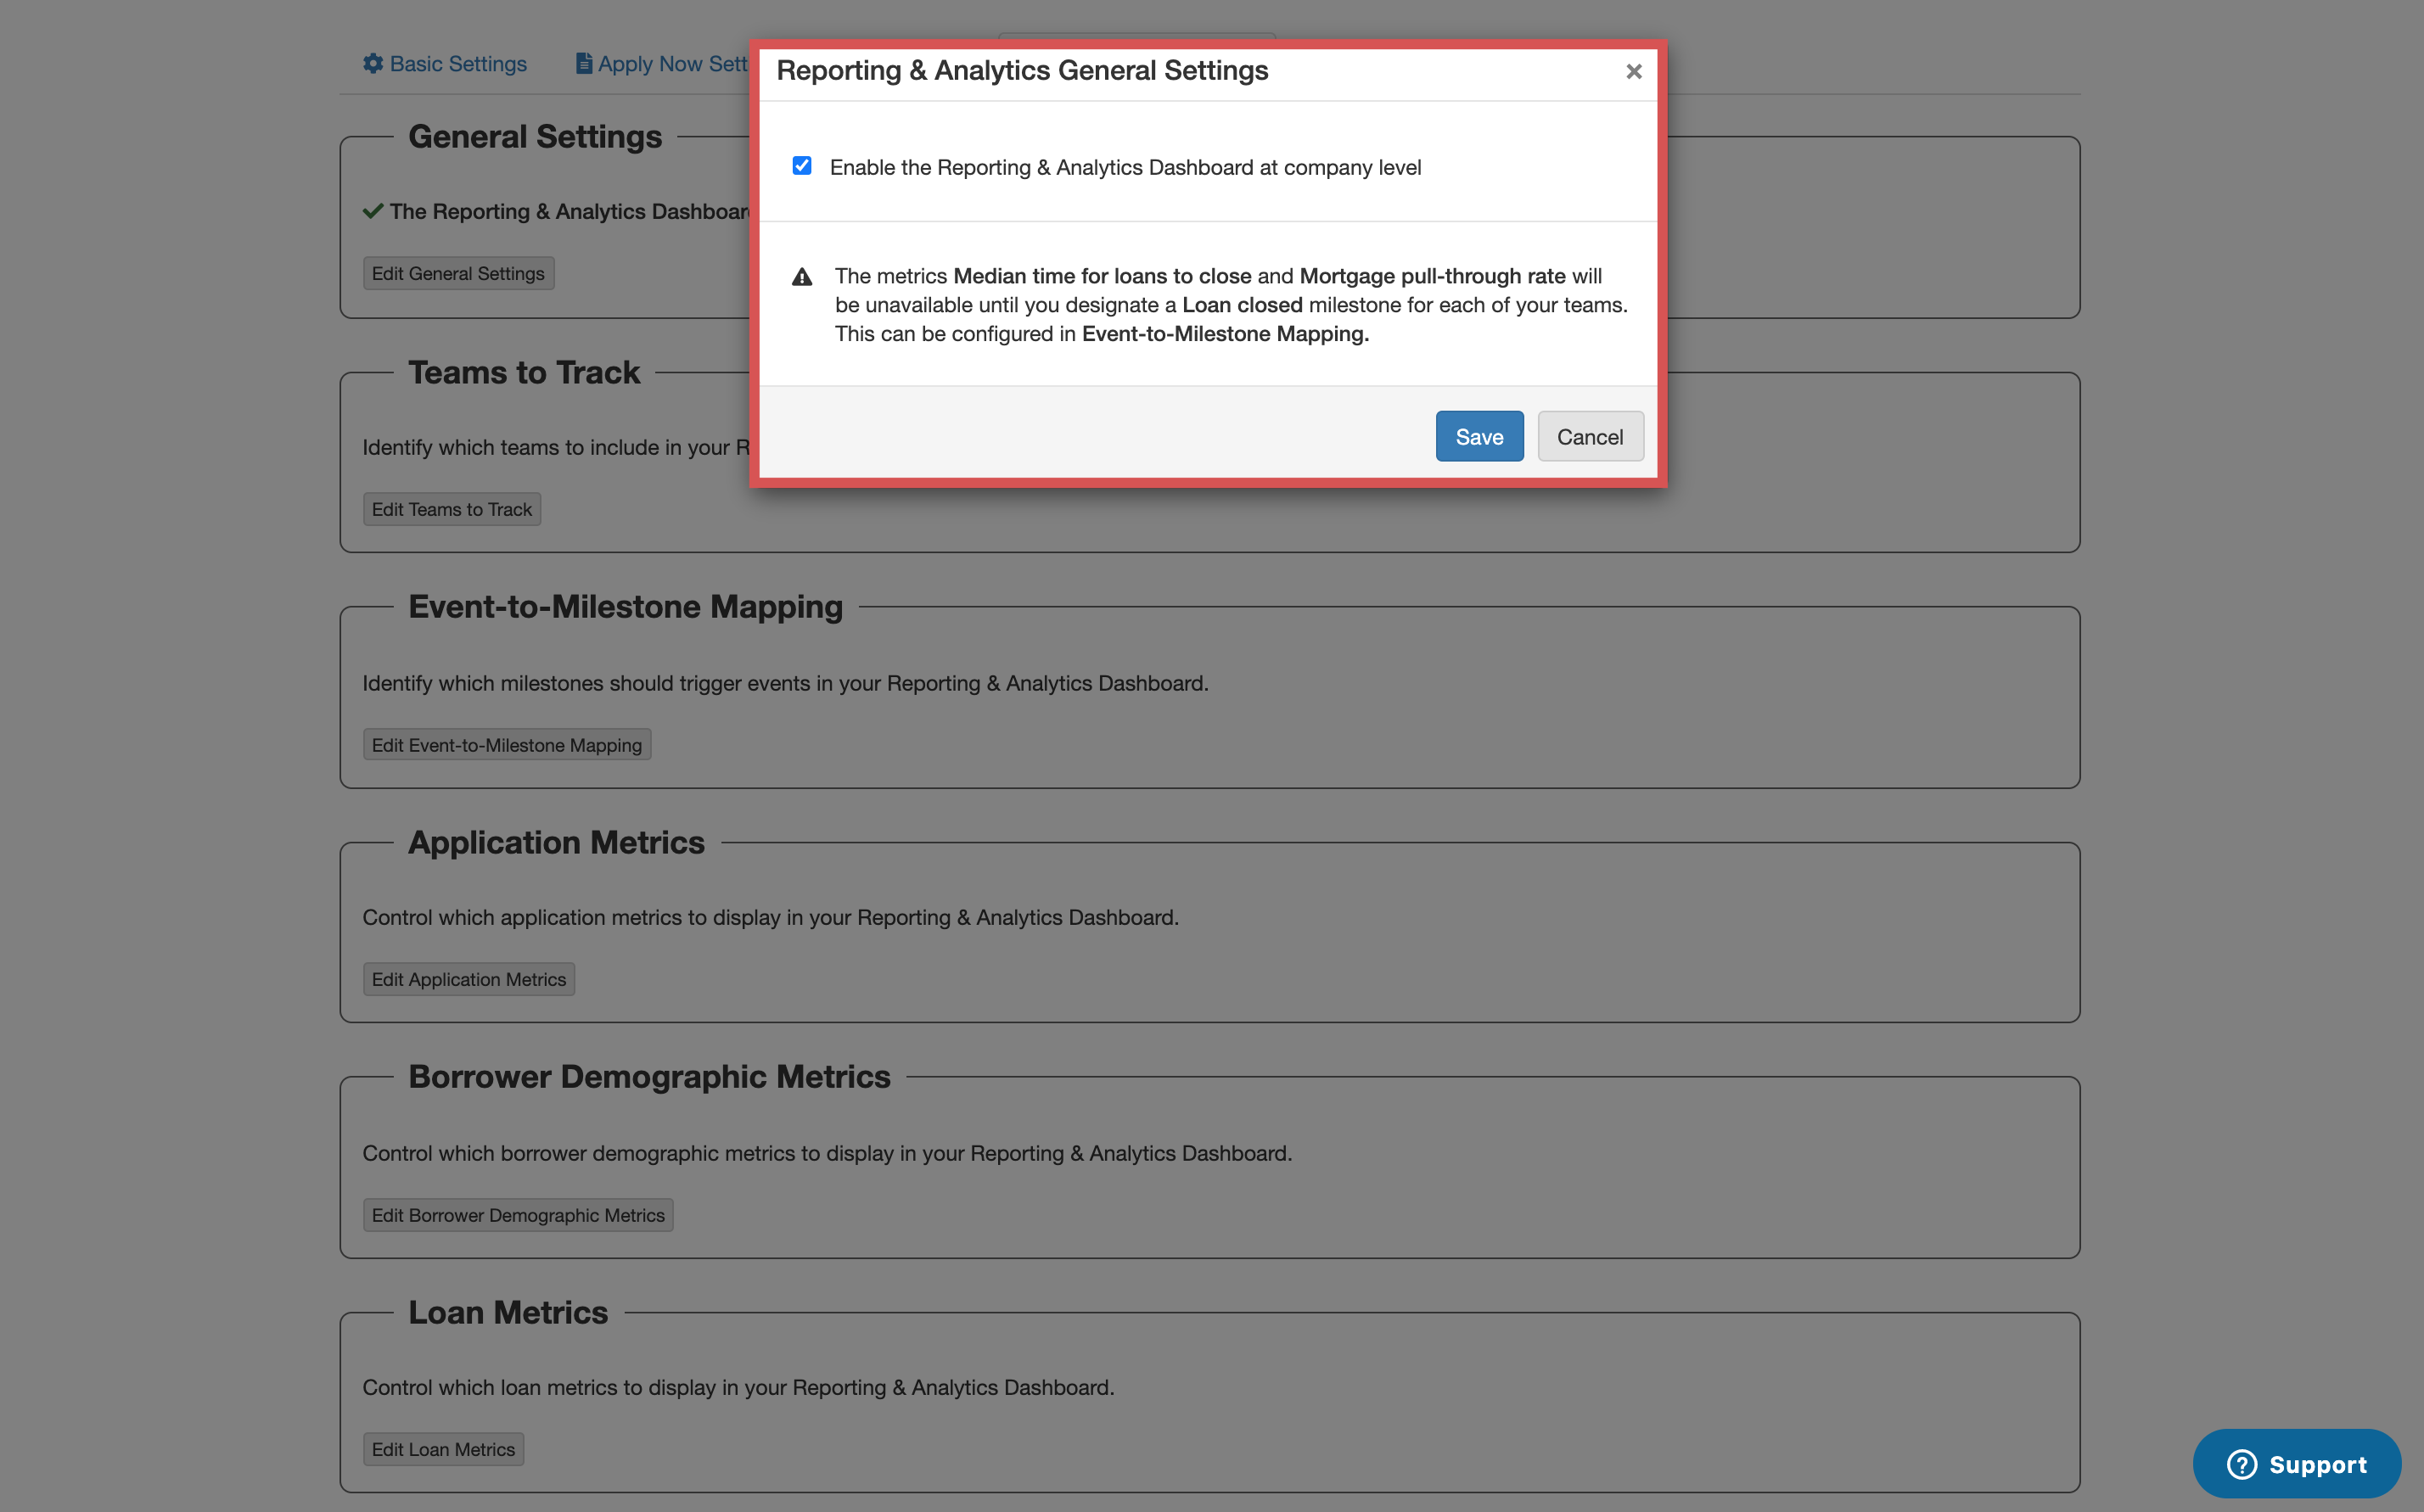
Select the option to enable reporting. Make sure you select Save to confirm the change:
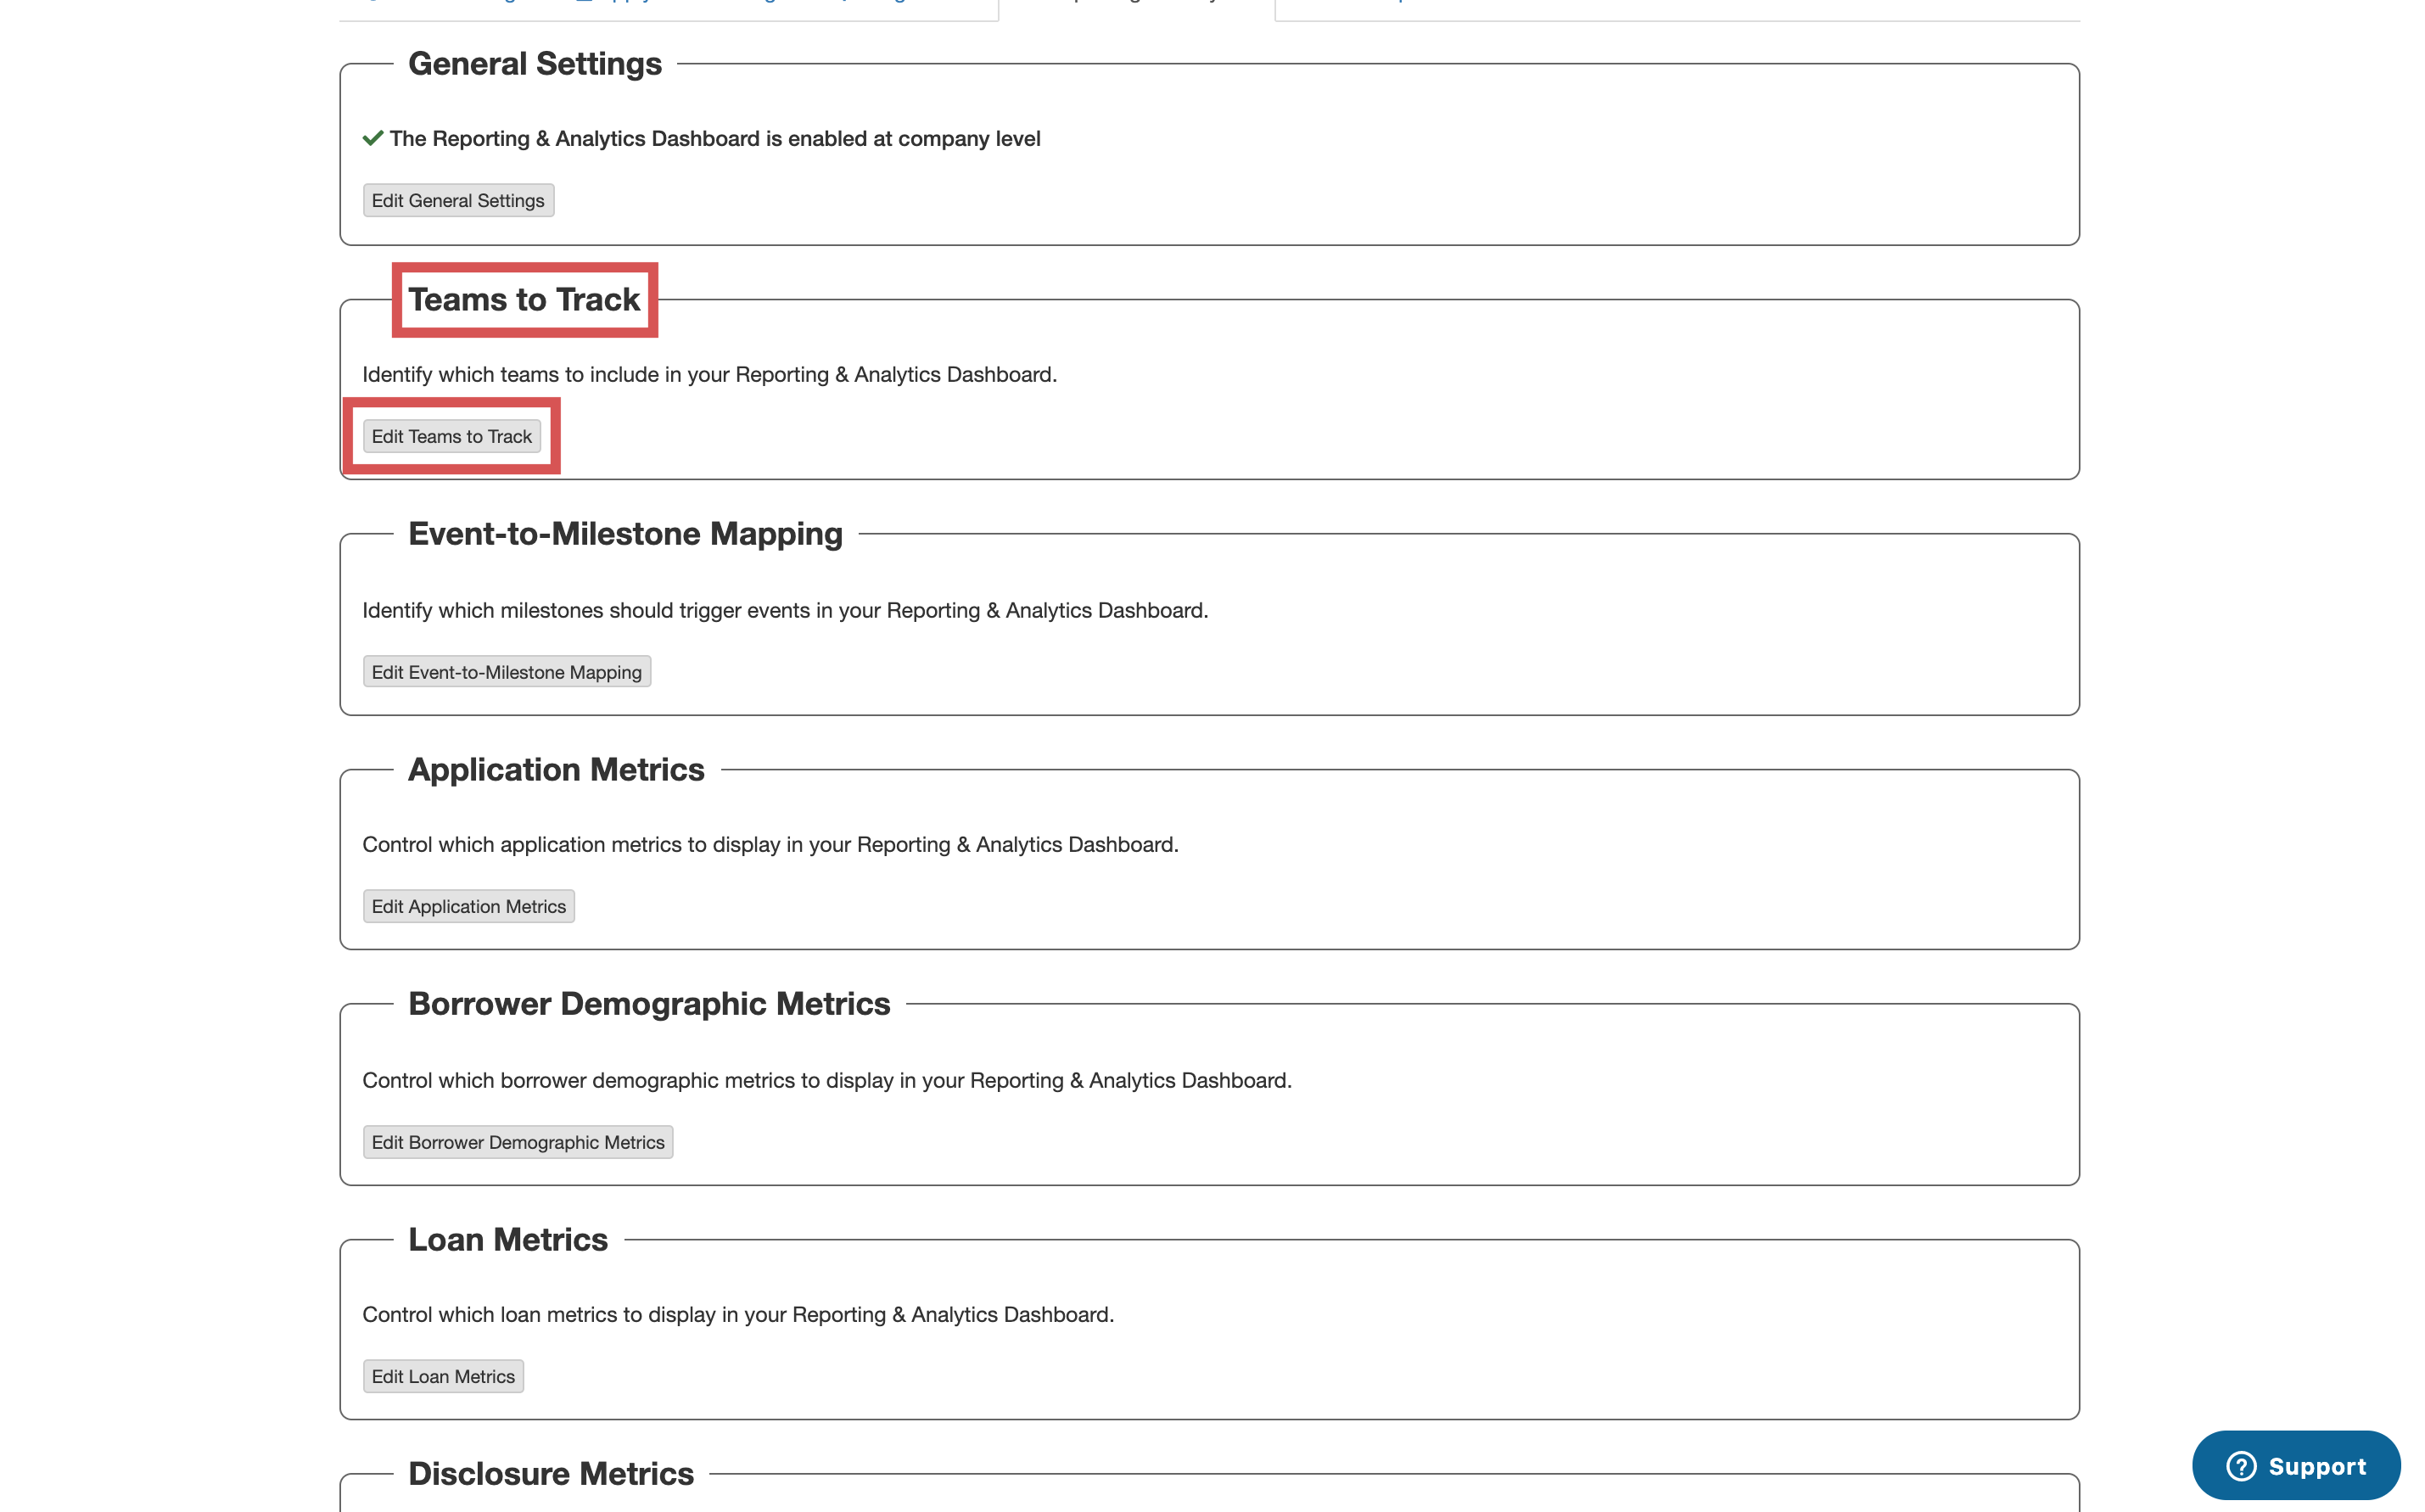
To select which teams are including in the dashboard, select Teams to Track and then the option to Edit Teams to Track:
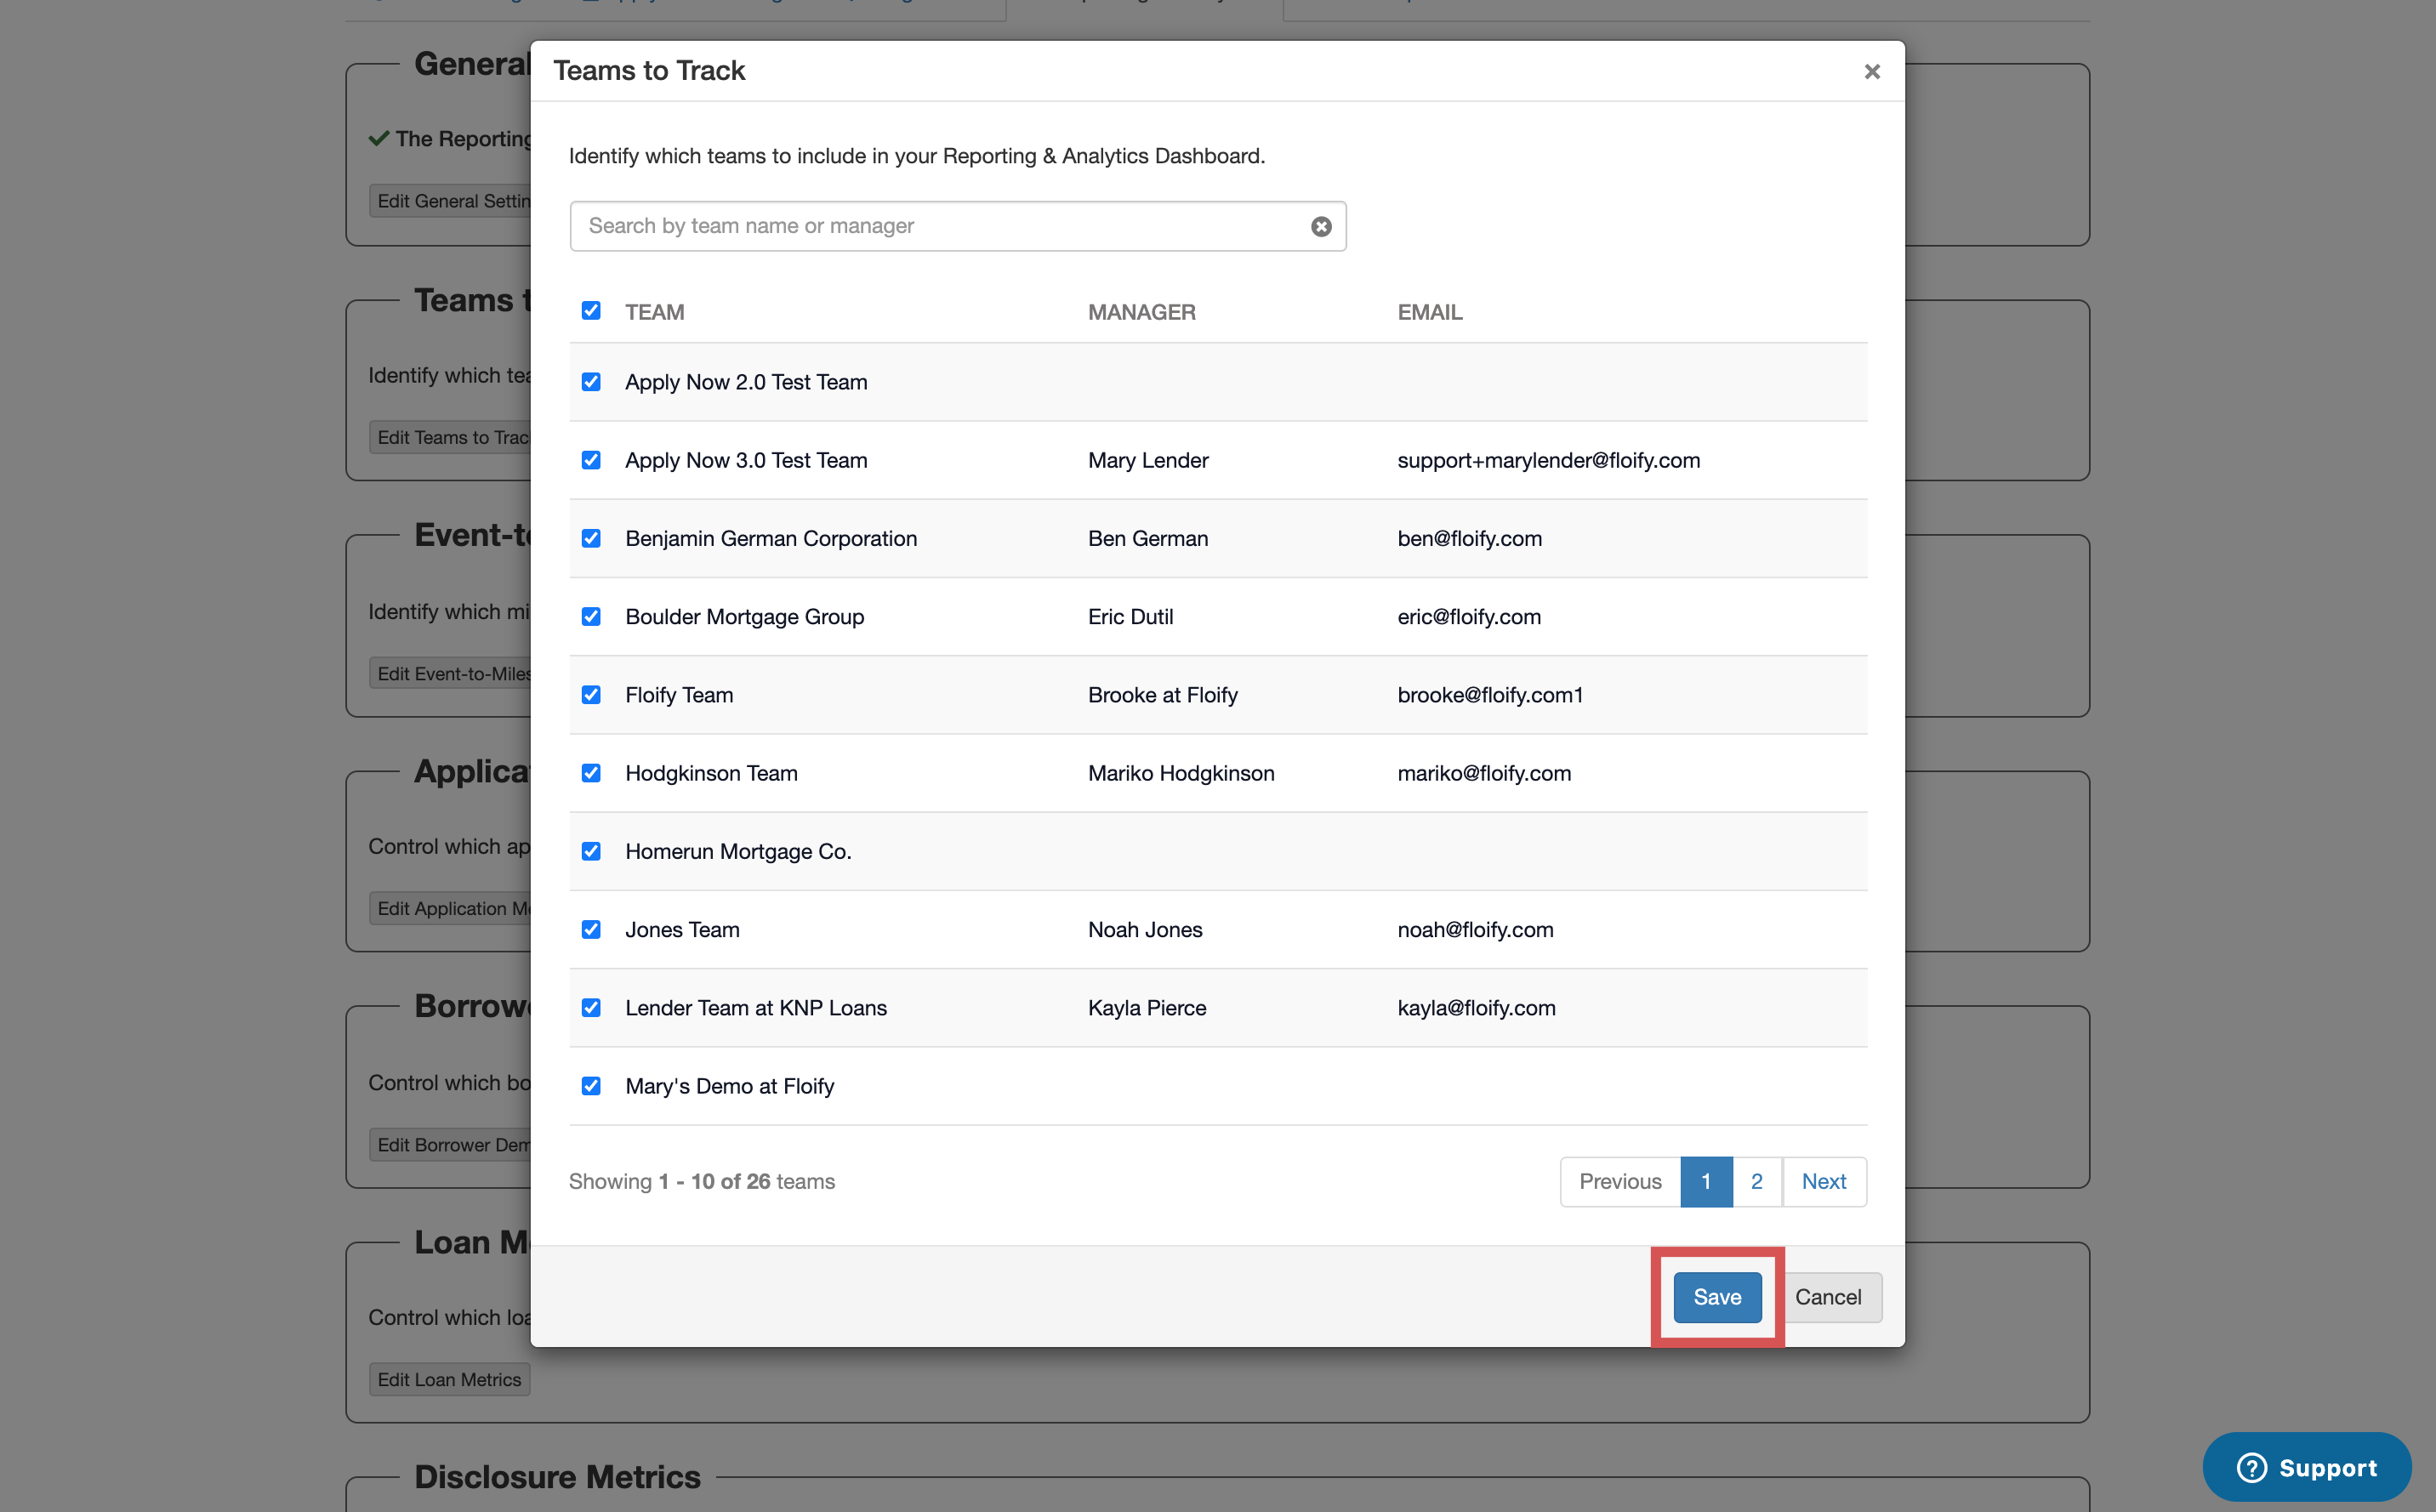
Select the teams that you would like to track and include in the dashboard. Make sure you select Save to confirm your changes:
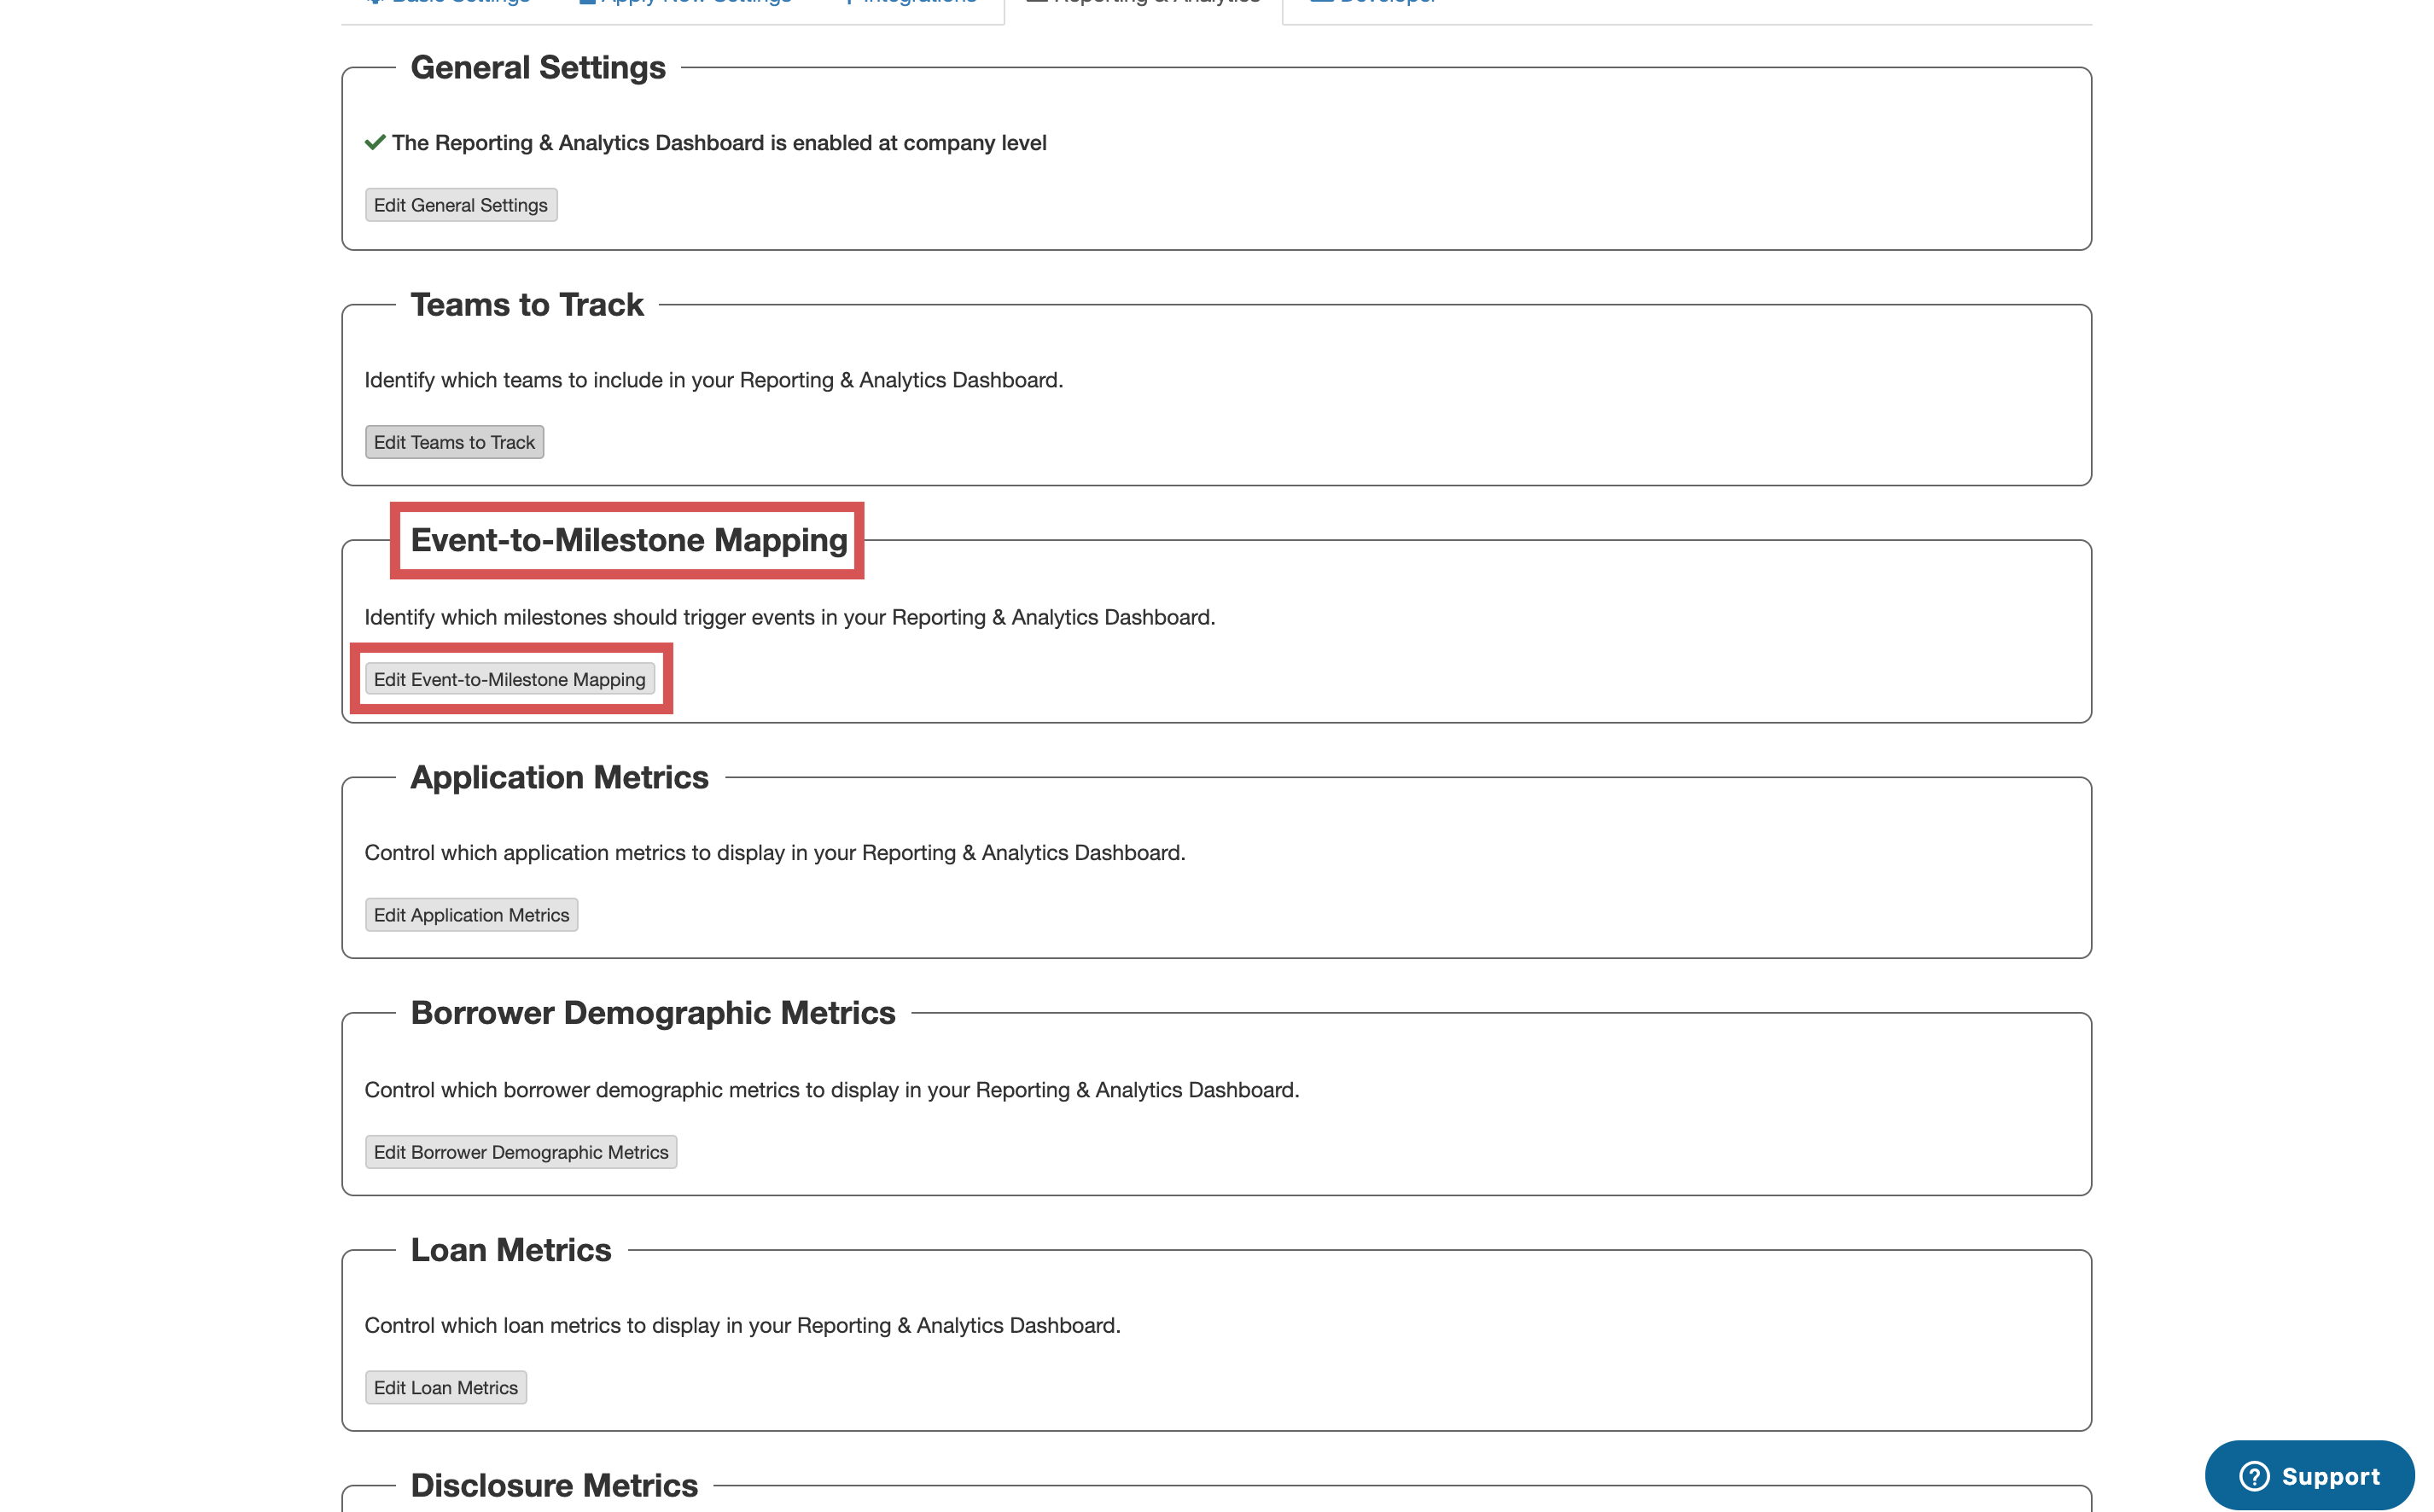
The Event-to-Milestone Mapping allows you to identify which milestones will trigger the Loan Closed and Loan Funded events in the dashboard. Select Event-to-Milestone Mapping and then the option to Edit Event-to-Milestone Mapping:
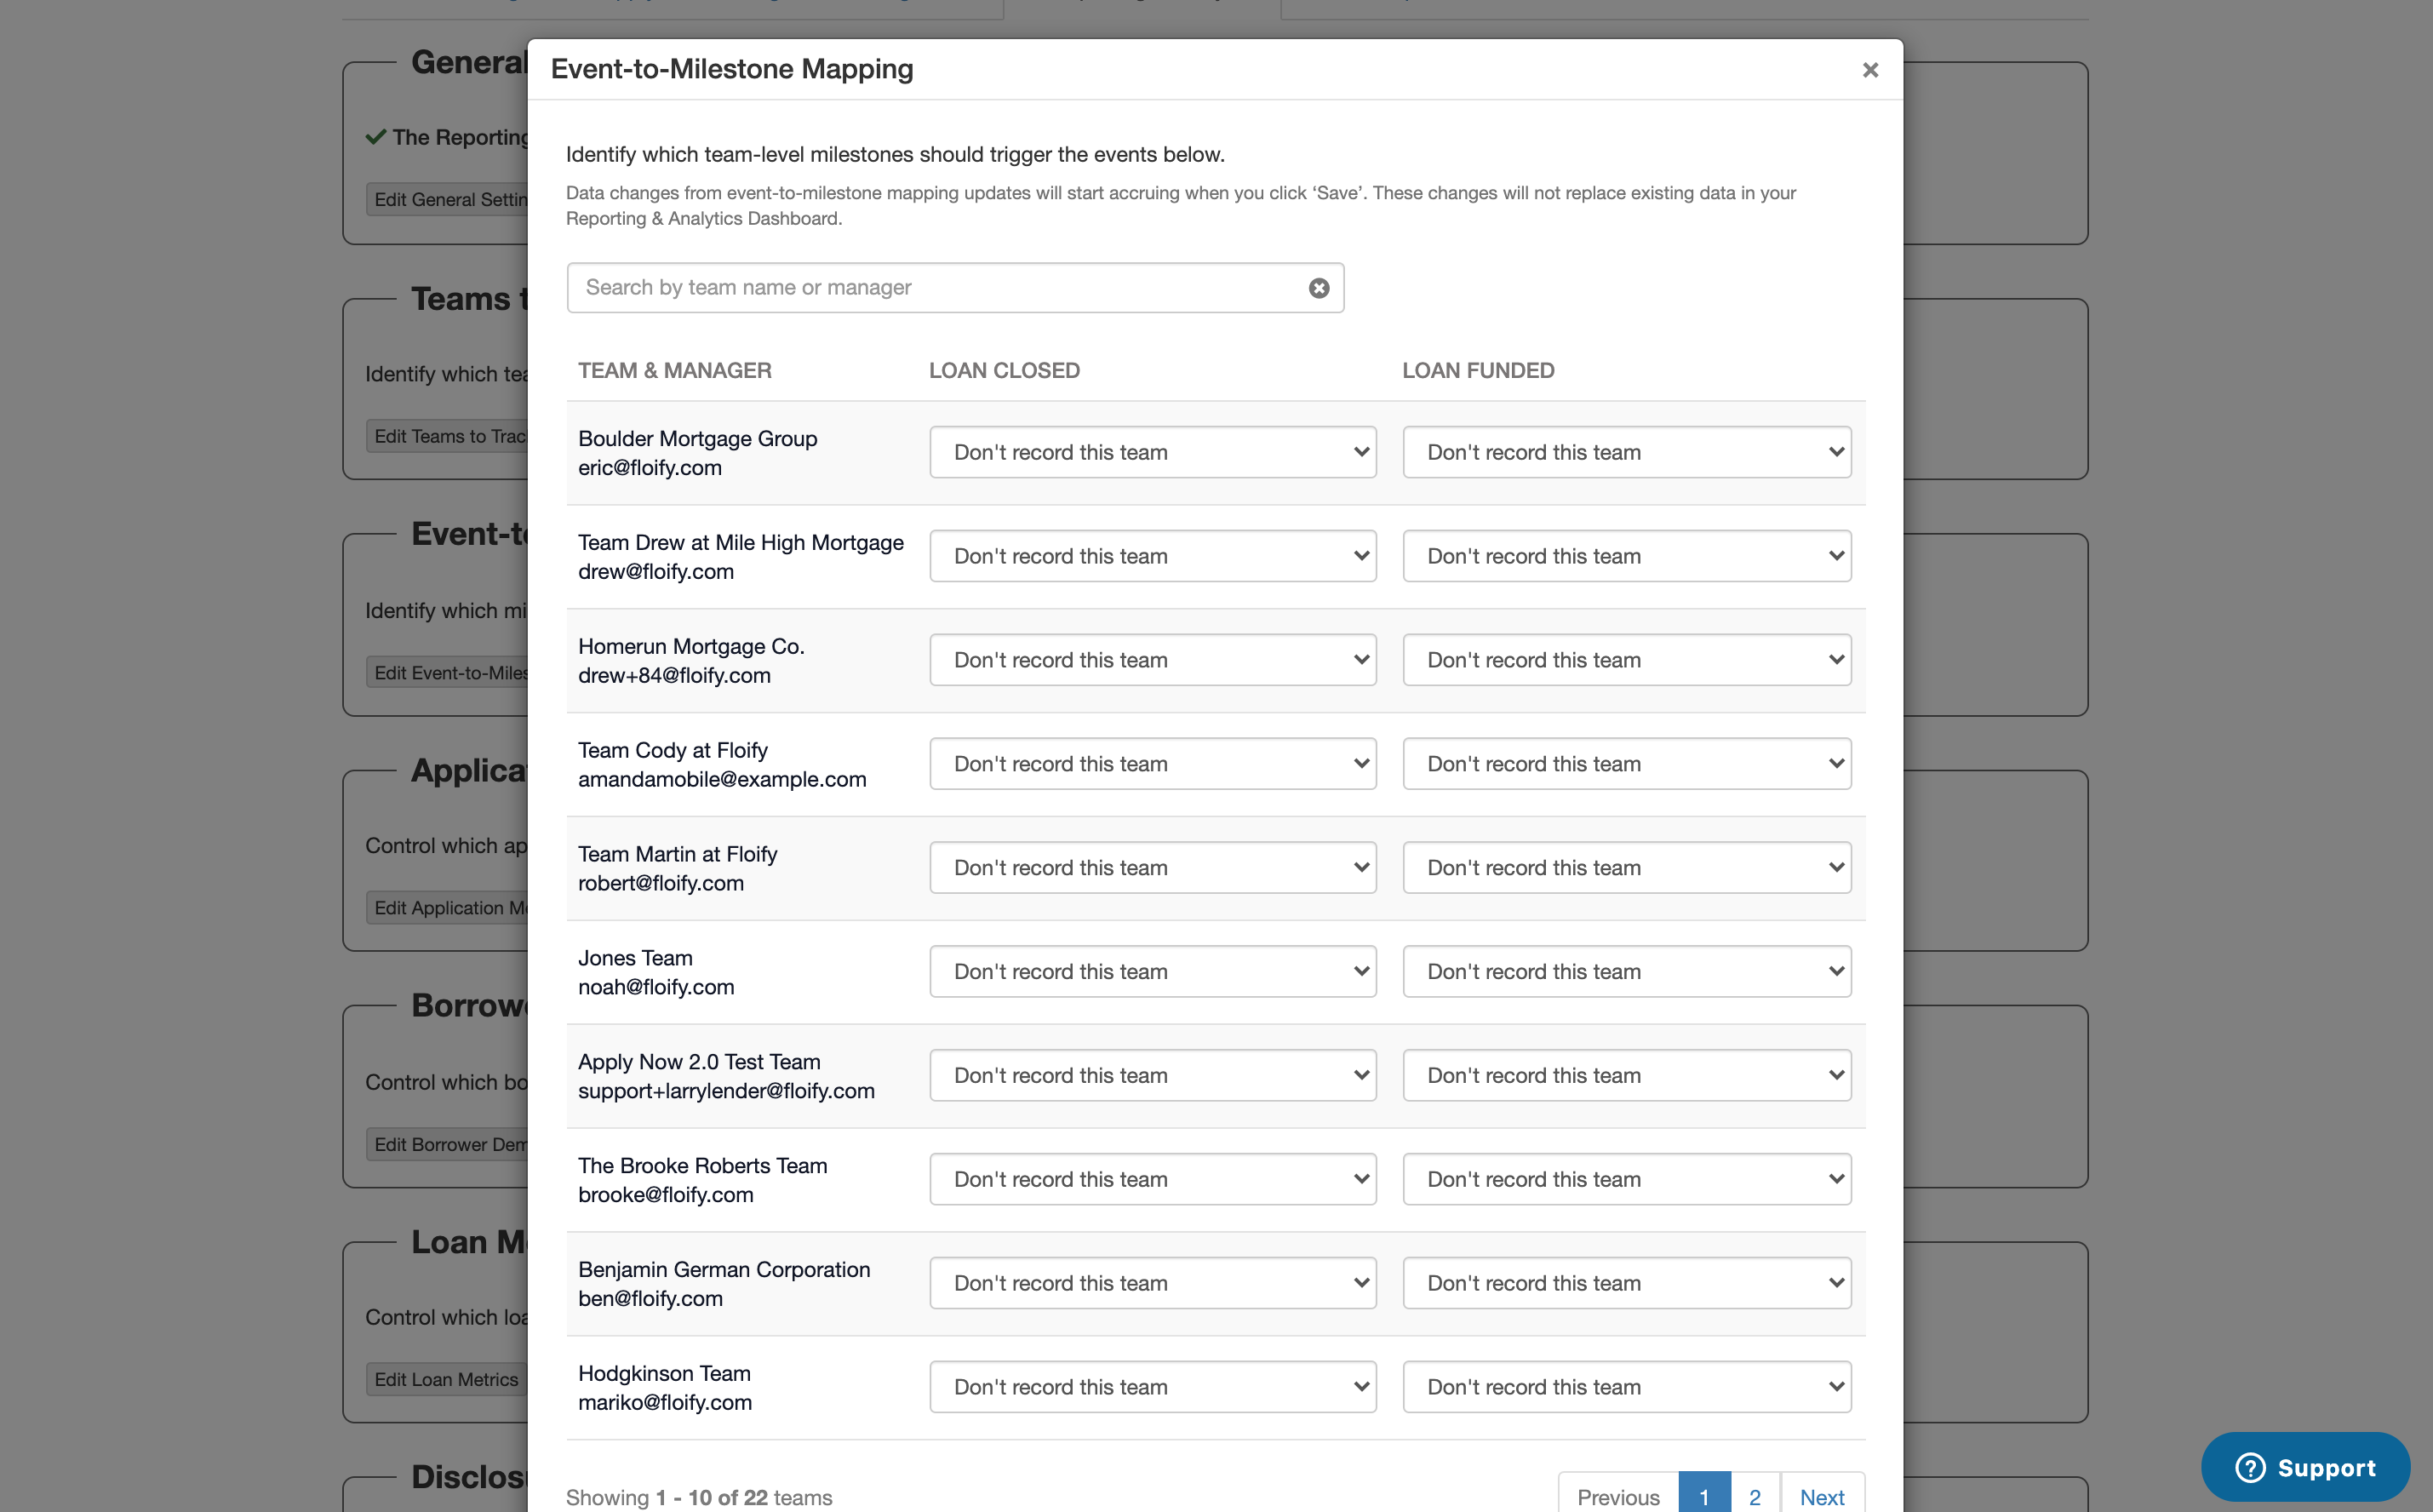
Select the milestones from the dropdown for each individual team. Make sure you scroll down and select Save to confirm the changes:
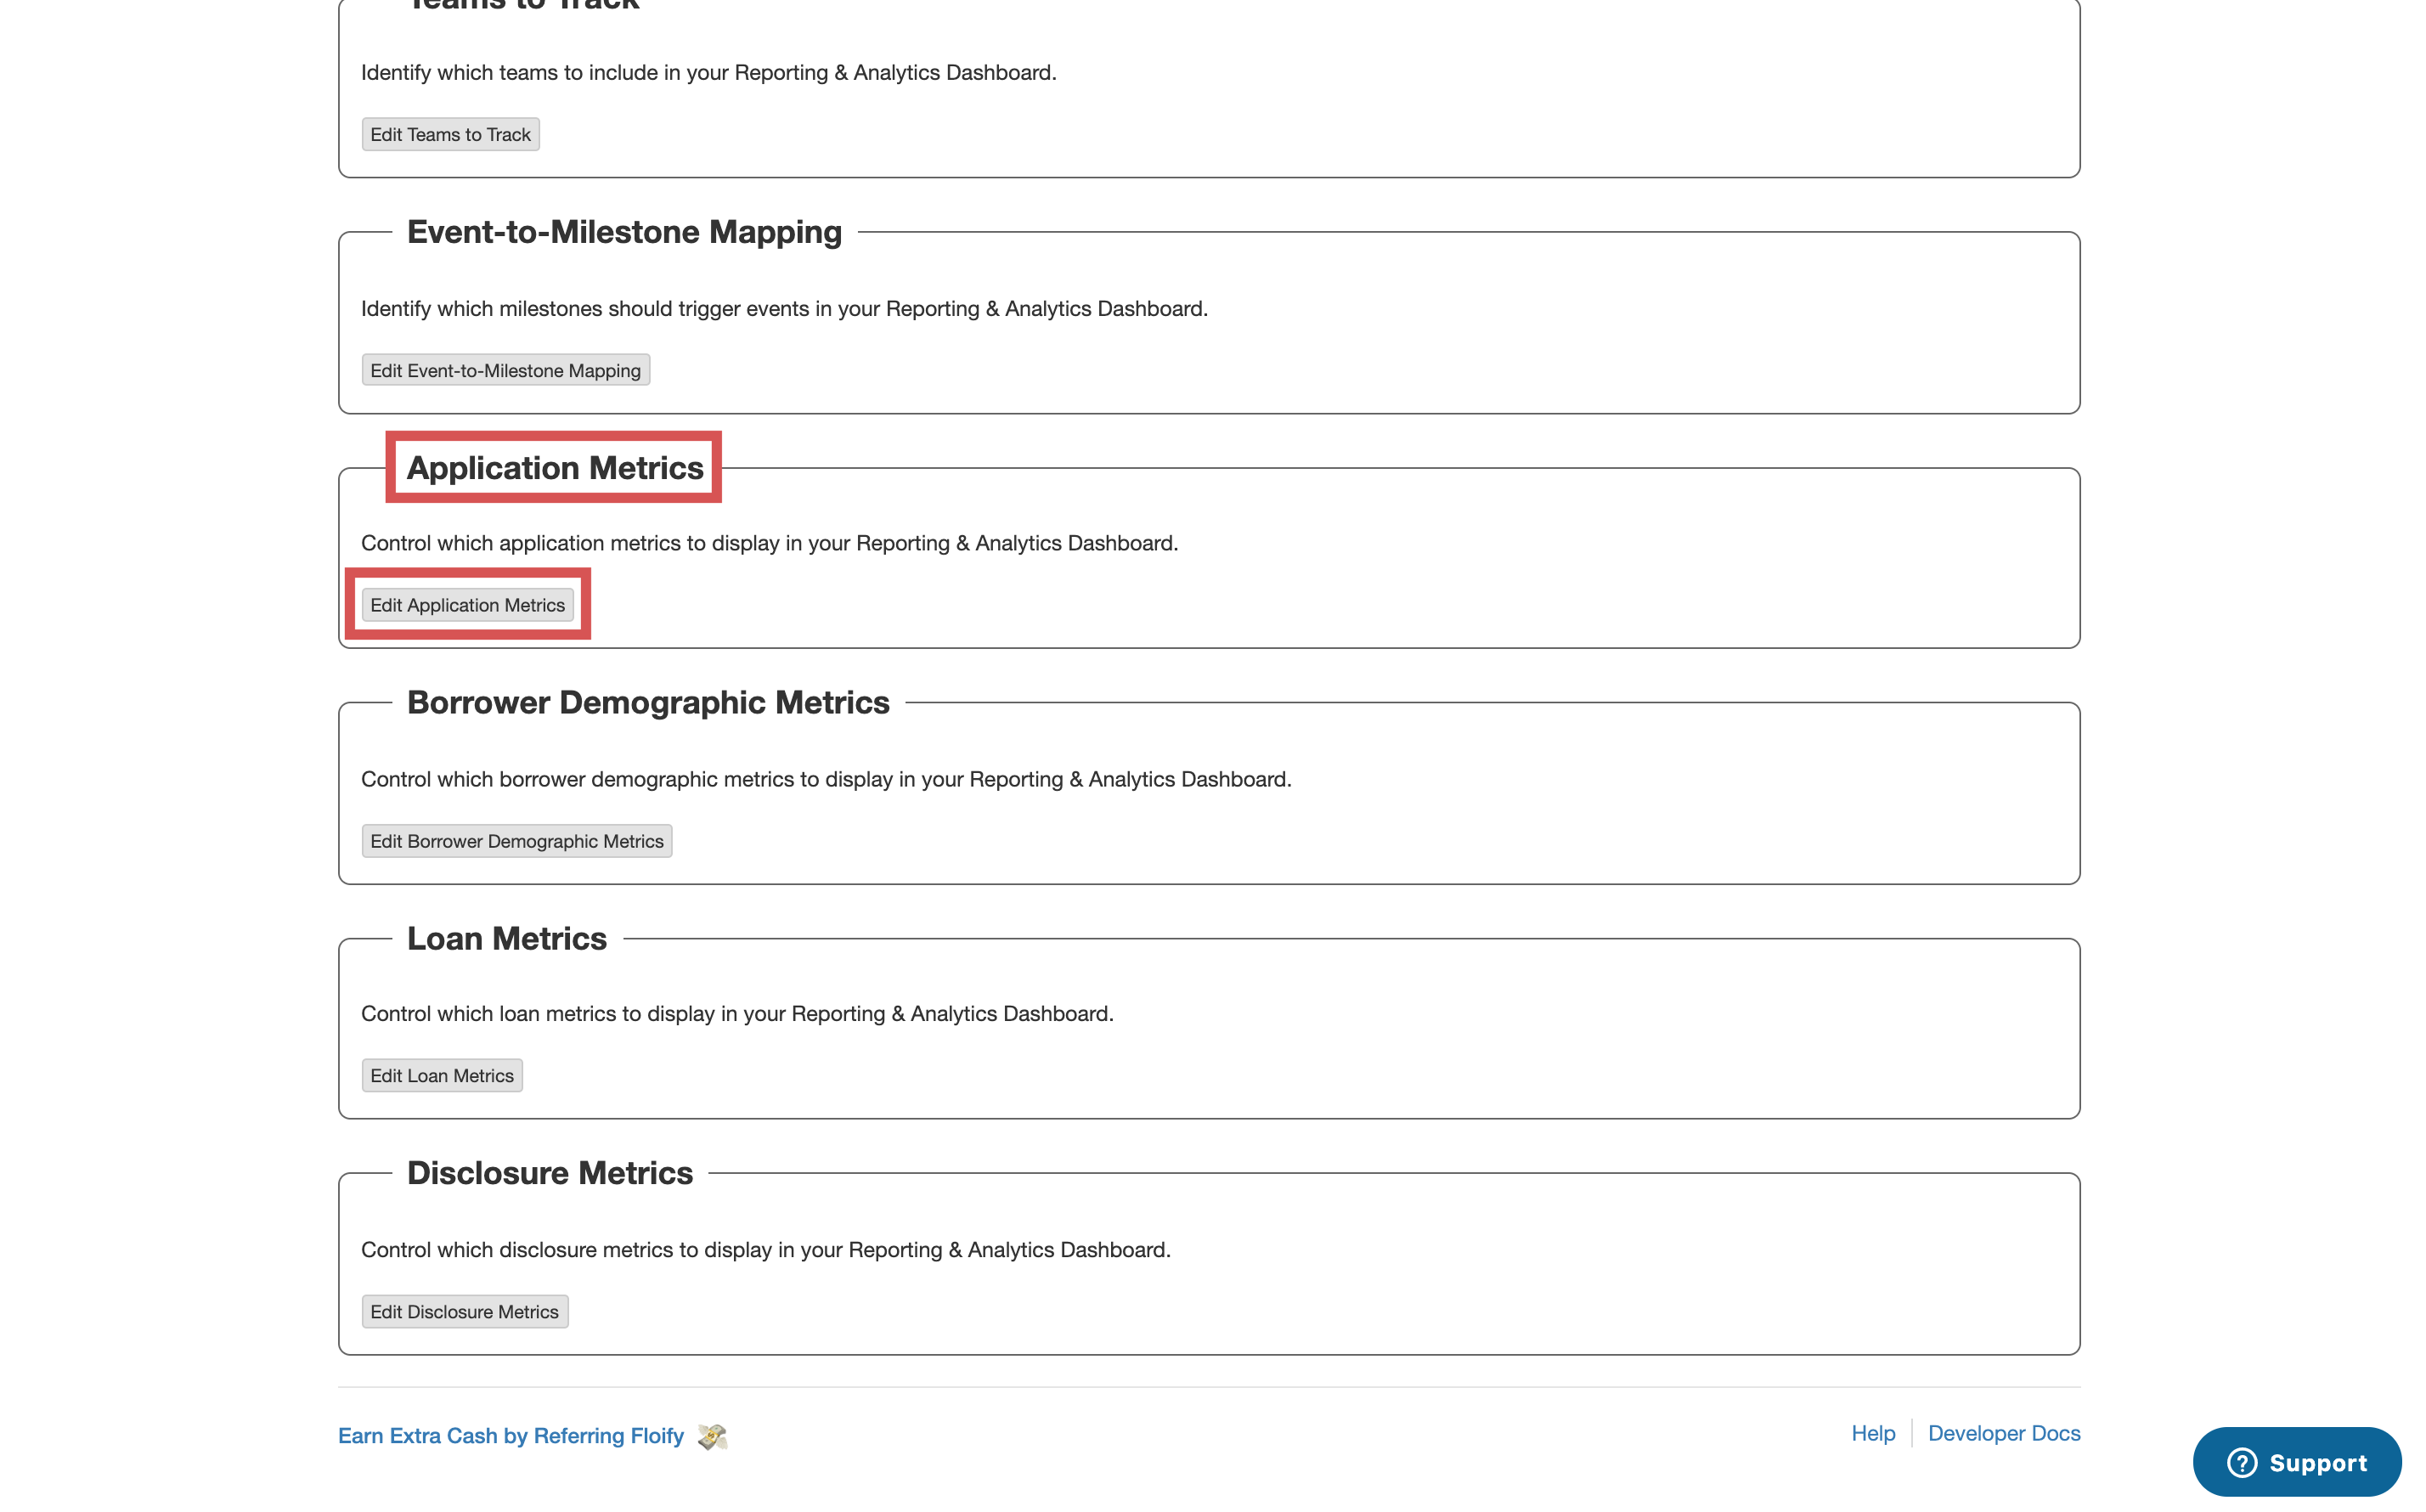
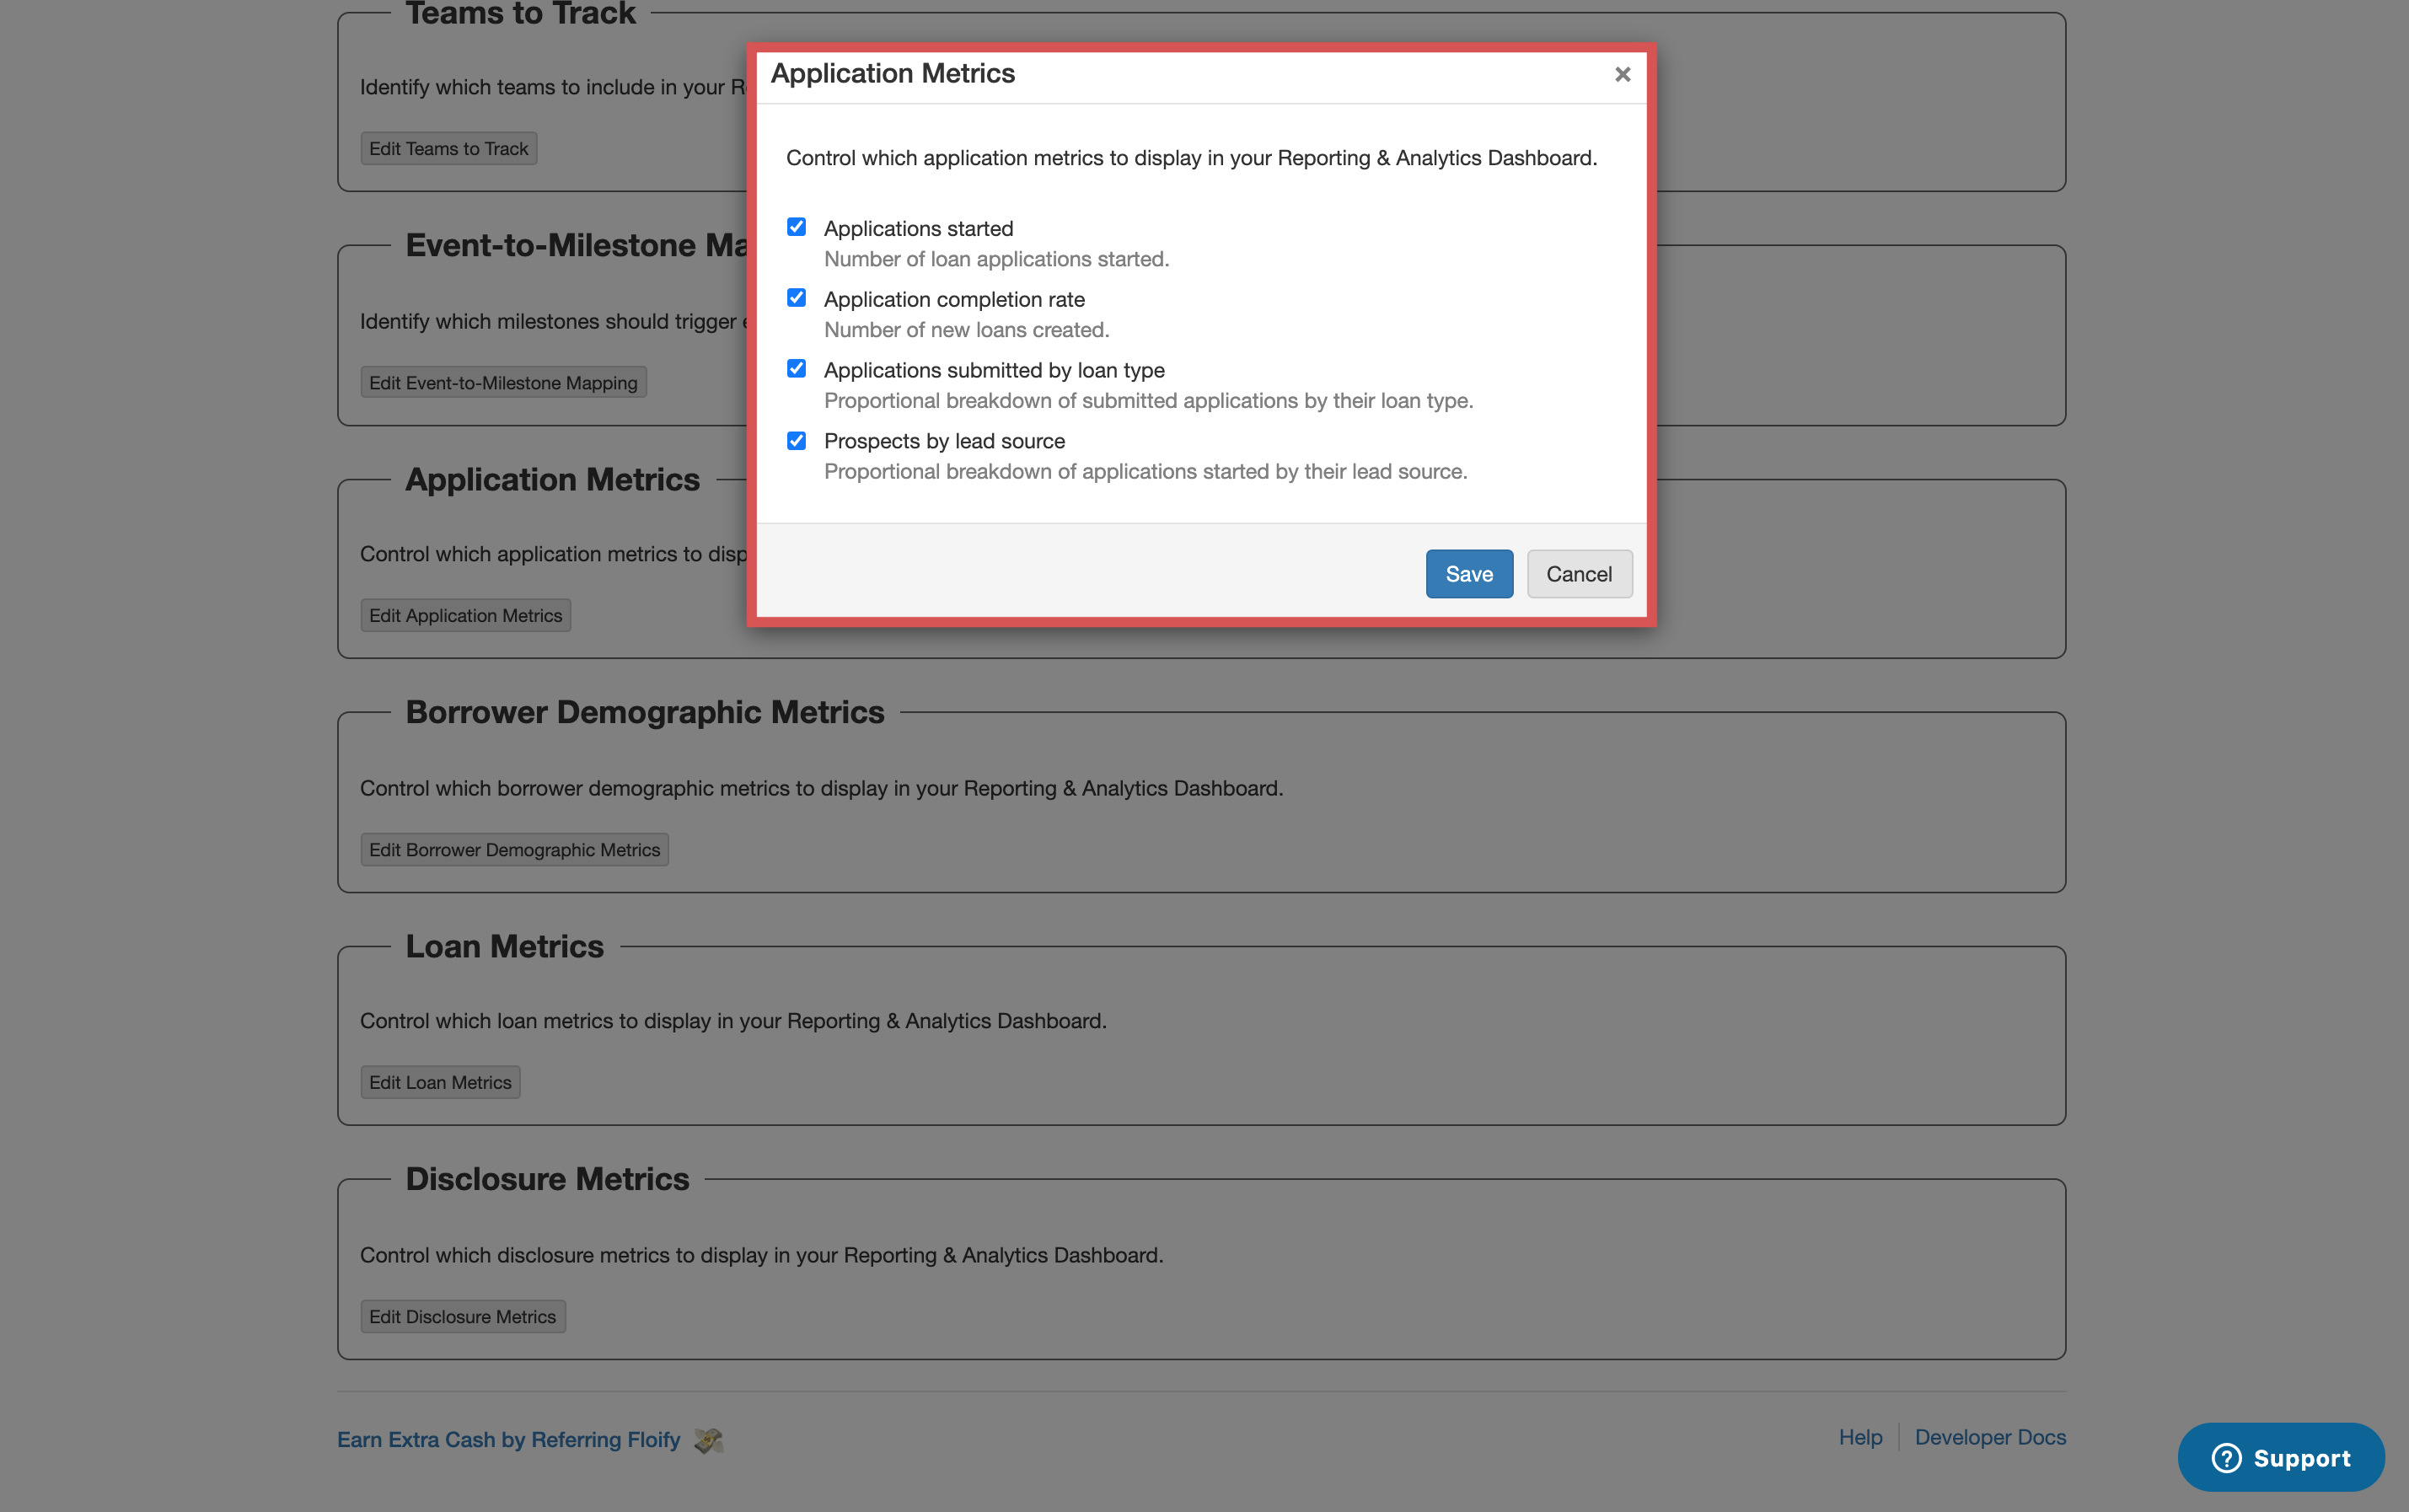
To control which application metrics display in your dashboard, select Application Metrics and then the option to Edit Application Metrics:
Select the metrics you'd like displayed. Make sure you select Save to confirm the changes:
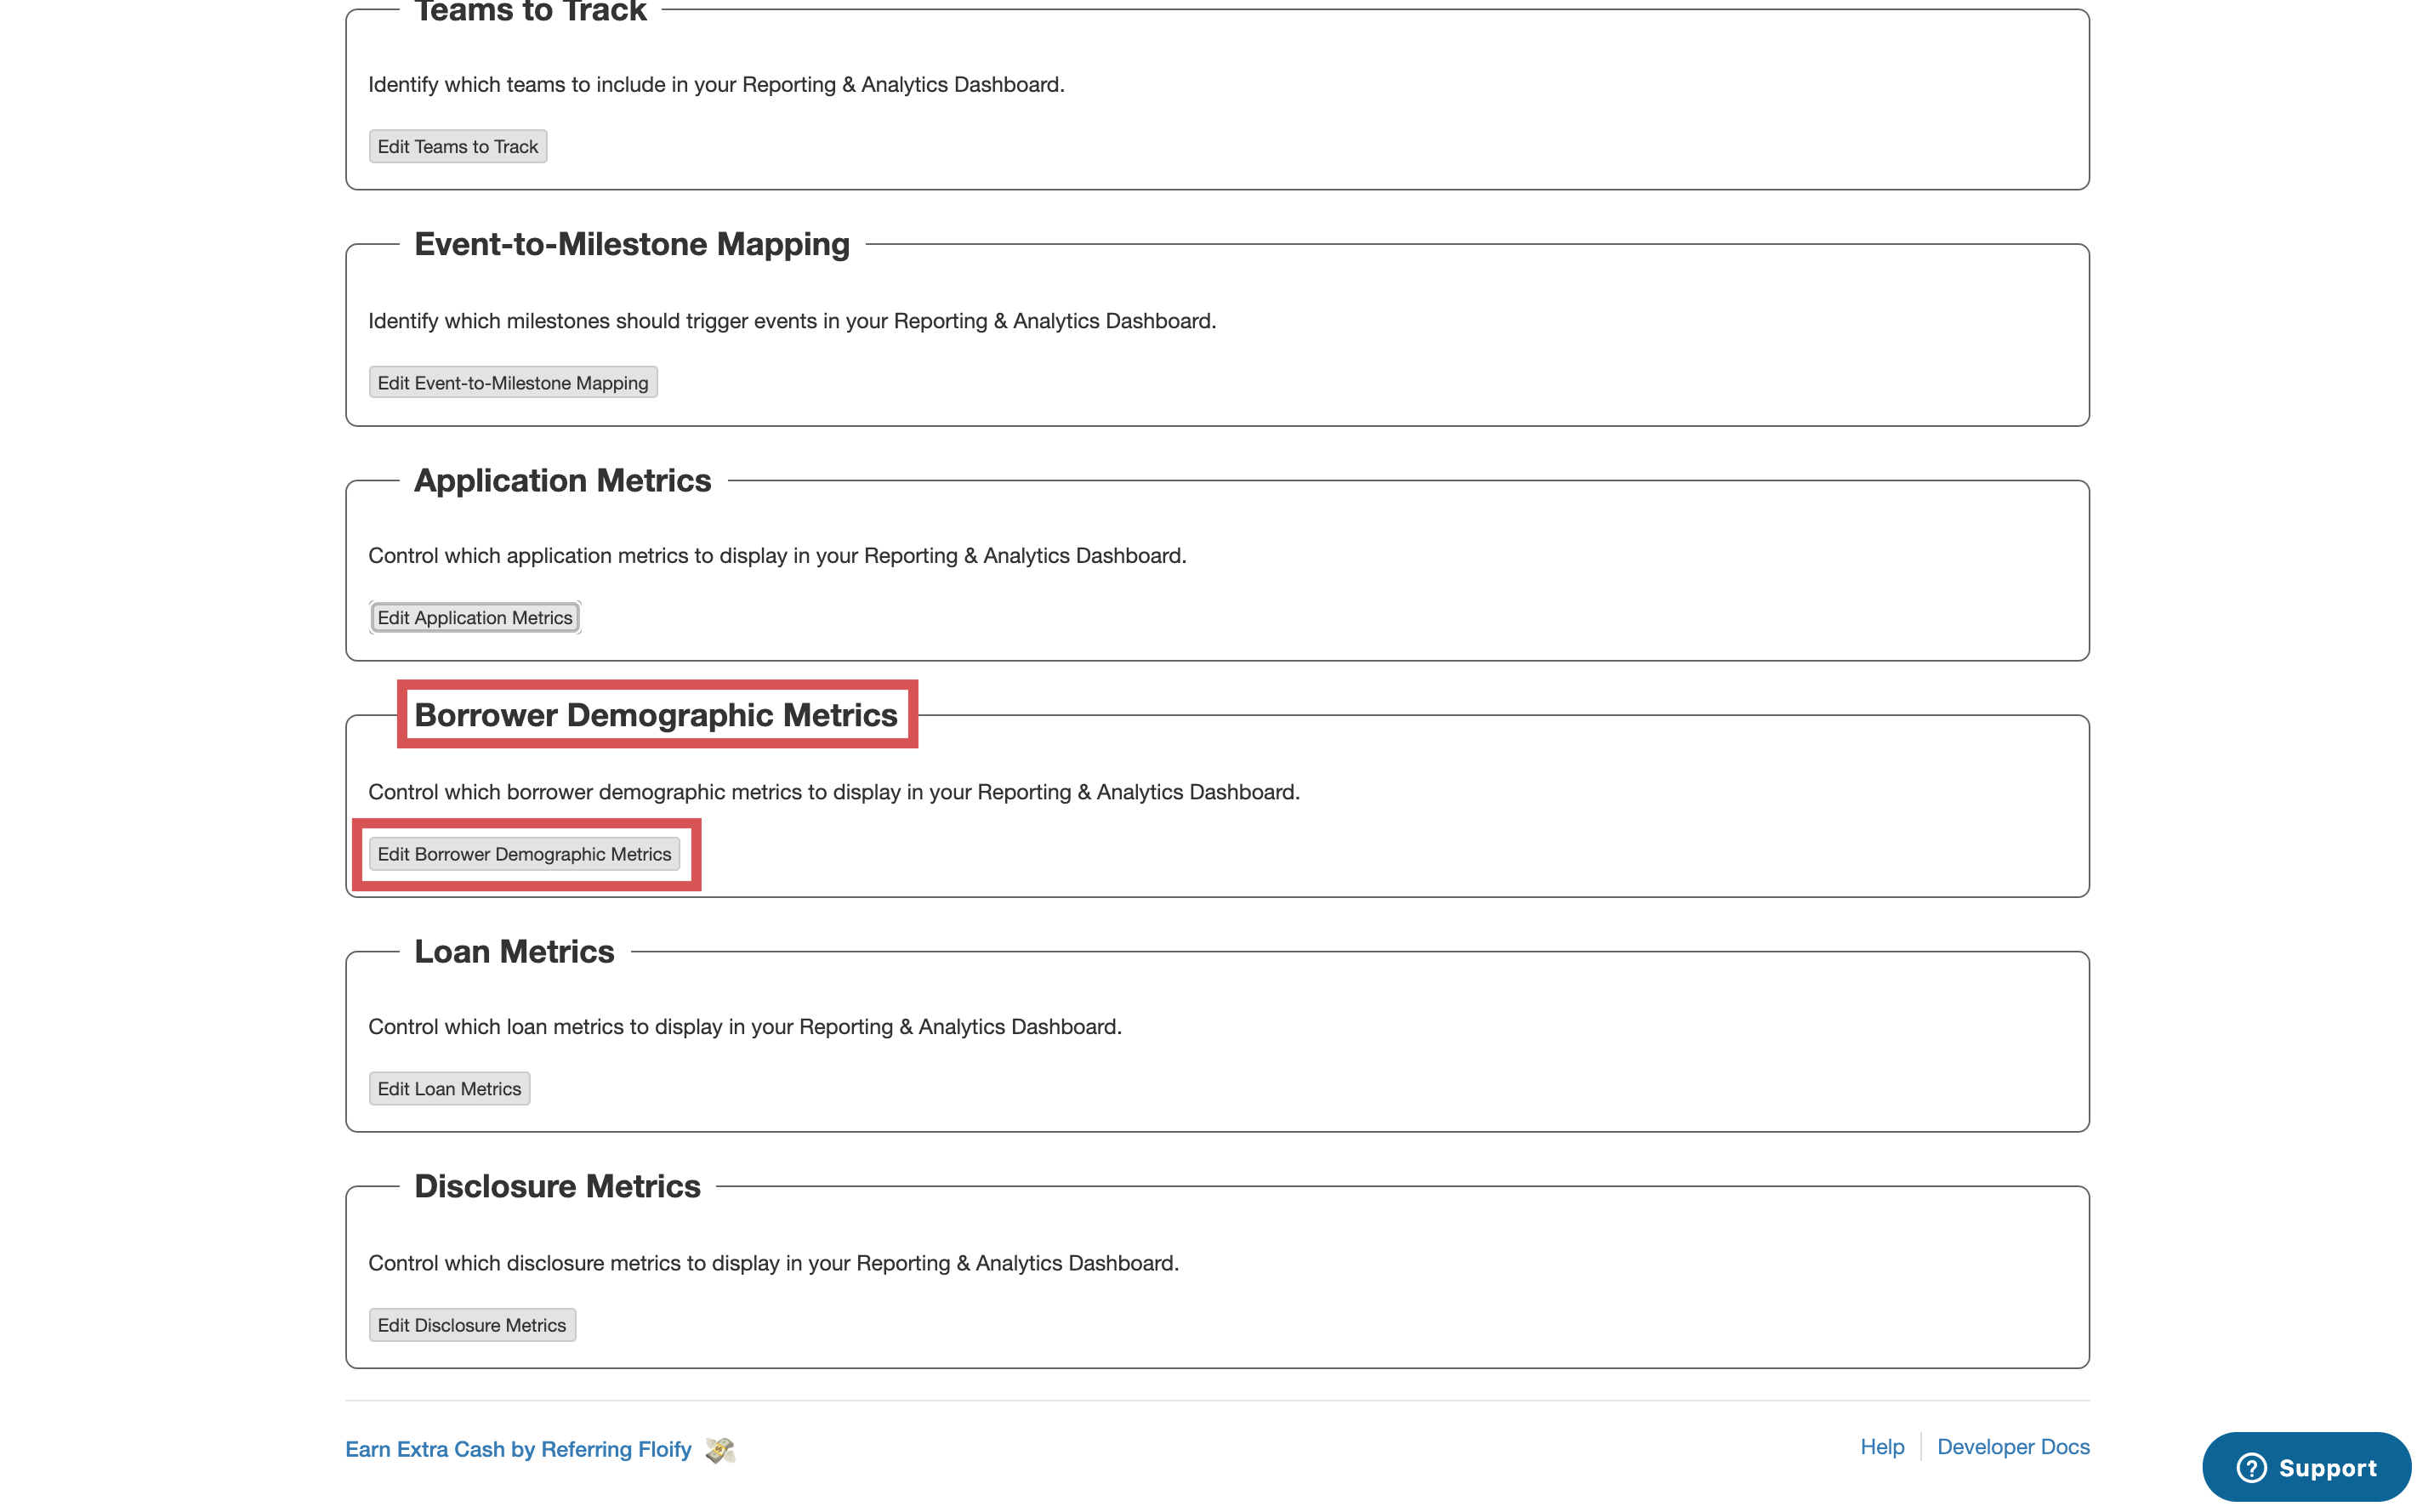
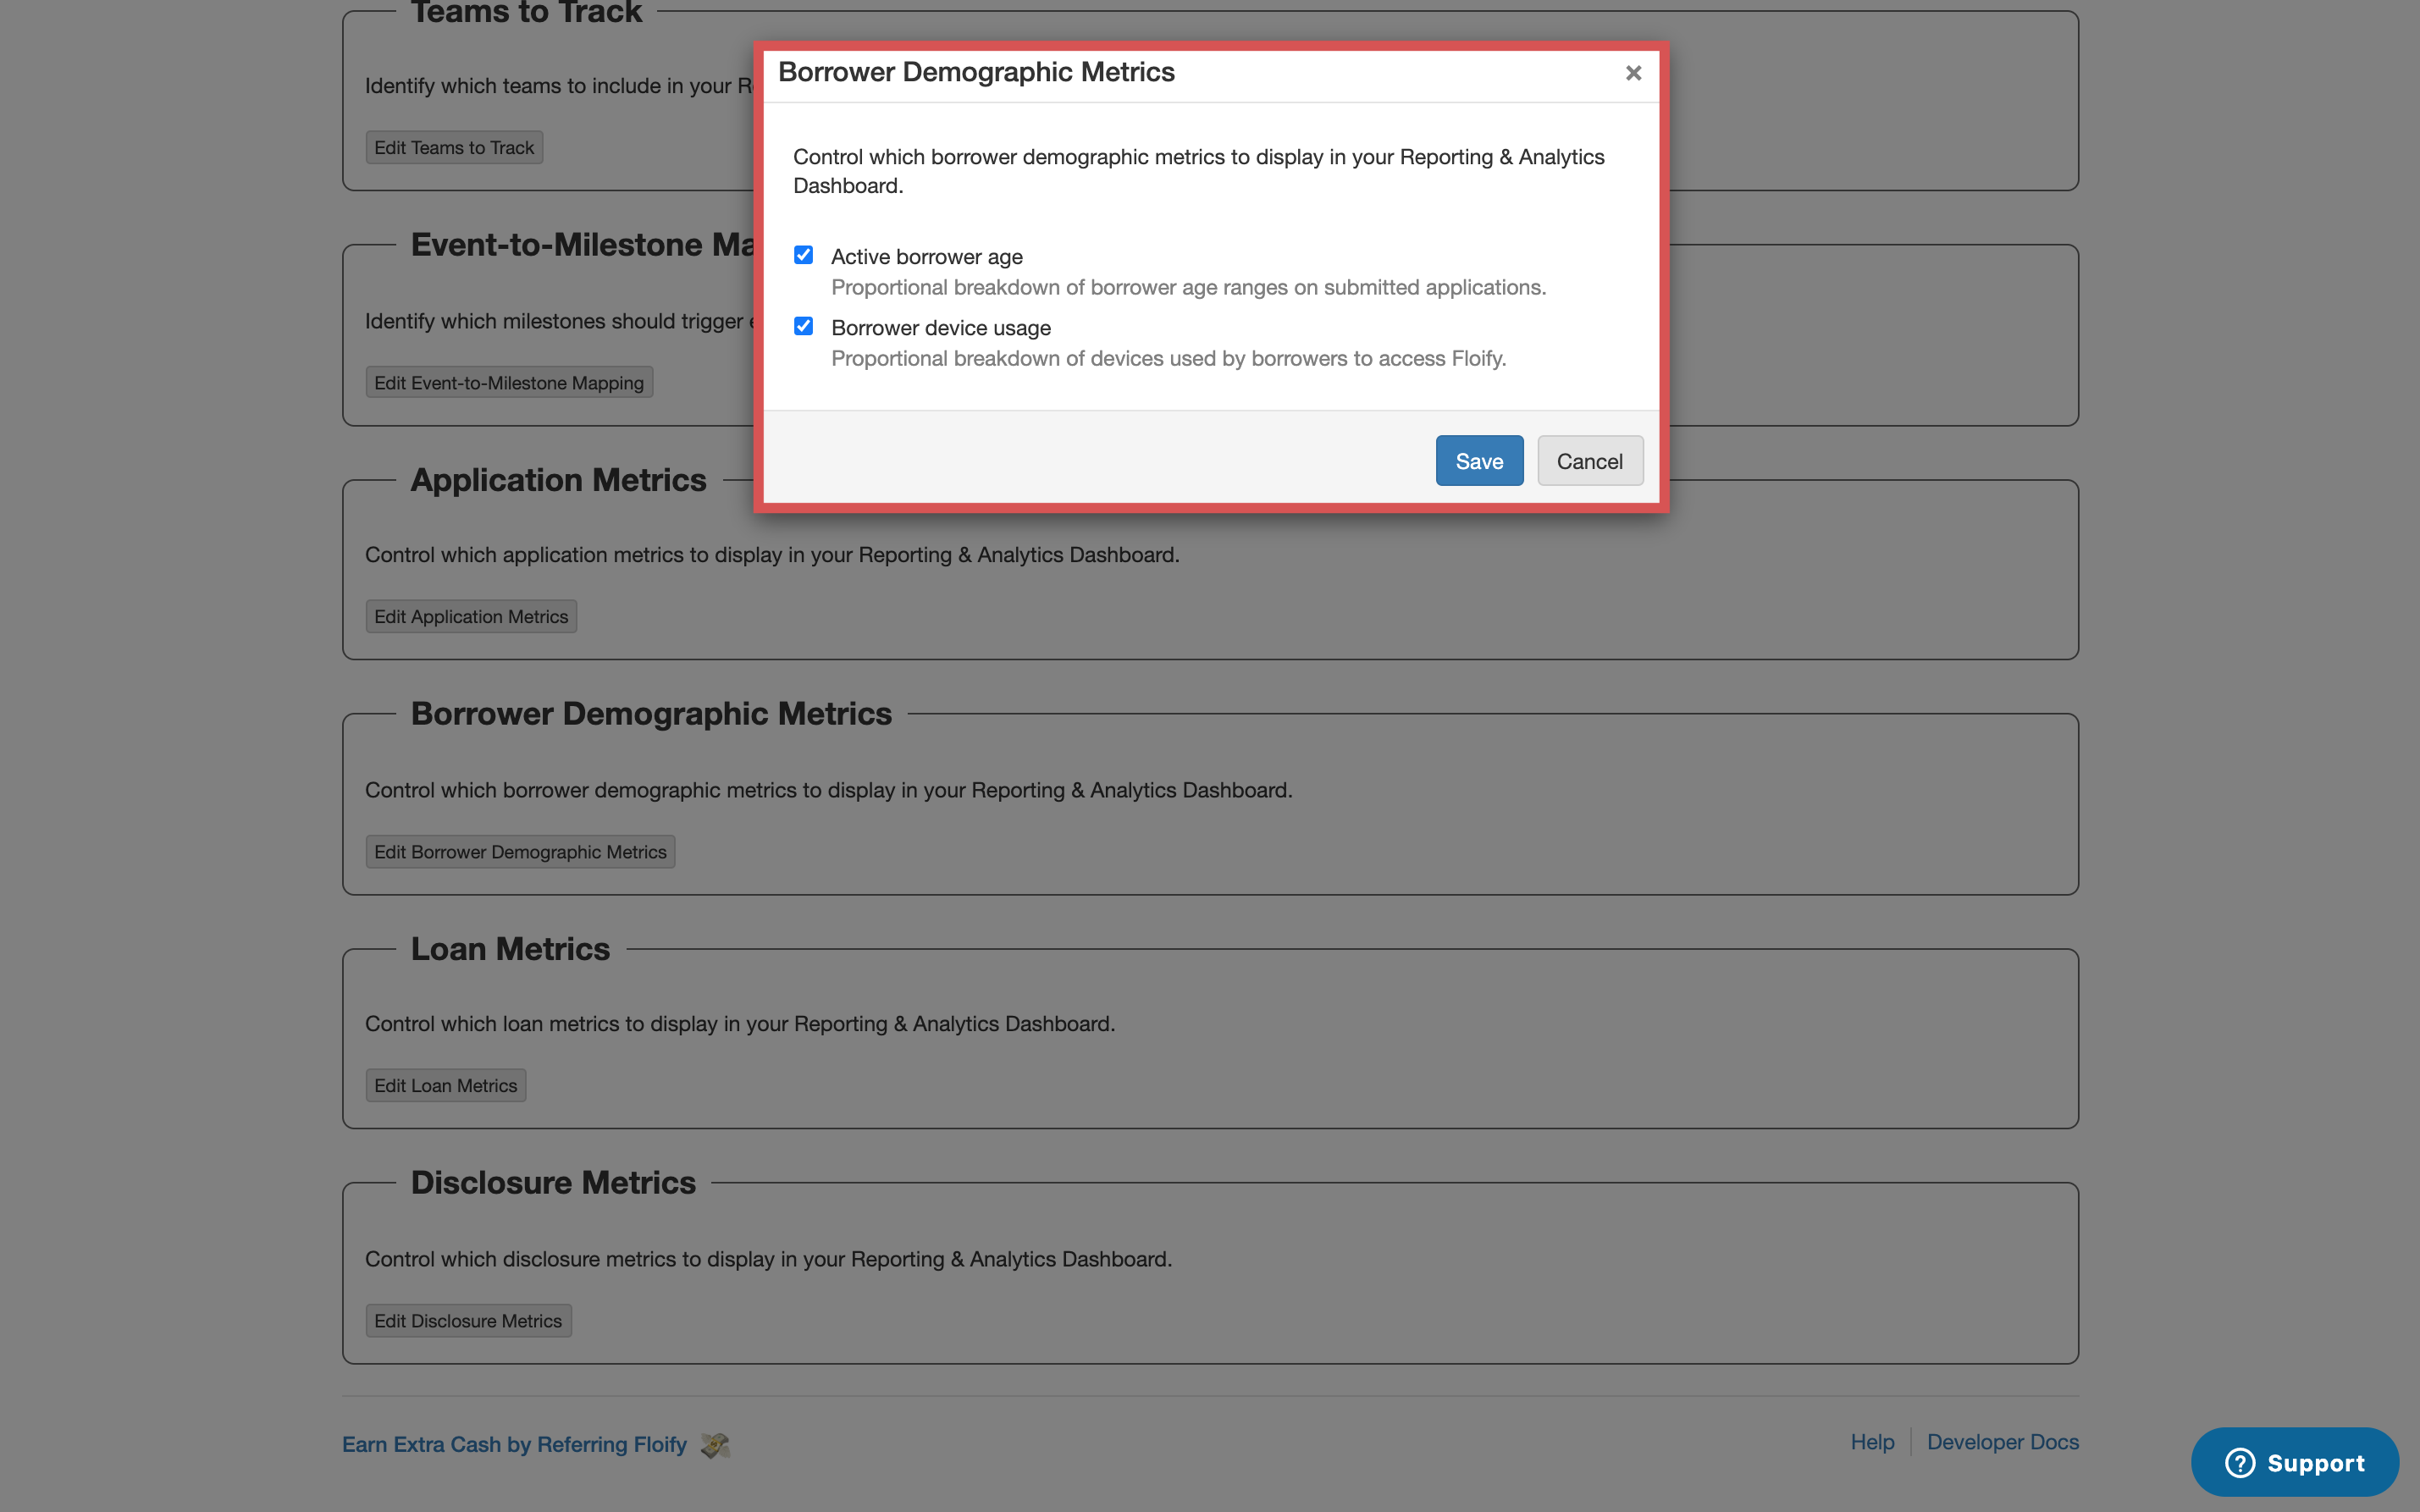
To control which borrower demographic metrics display in your dashboard, select Borrower Demographic Metrics and then the option to Edit Borrower Demographic Metrics:
Select the metrics you'd like displayed. Make sure you select Save to confirm the changes:
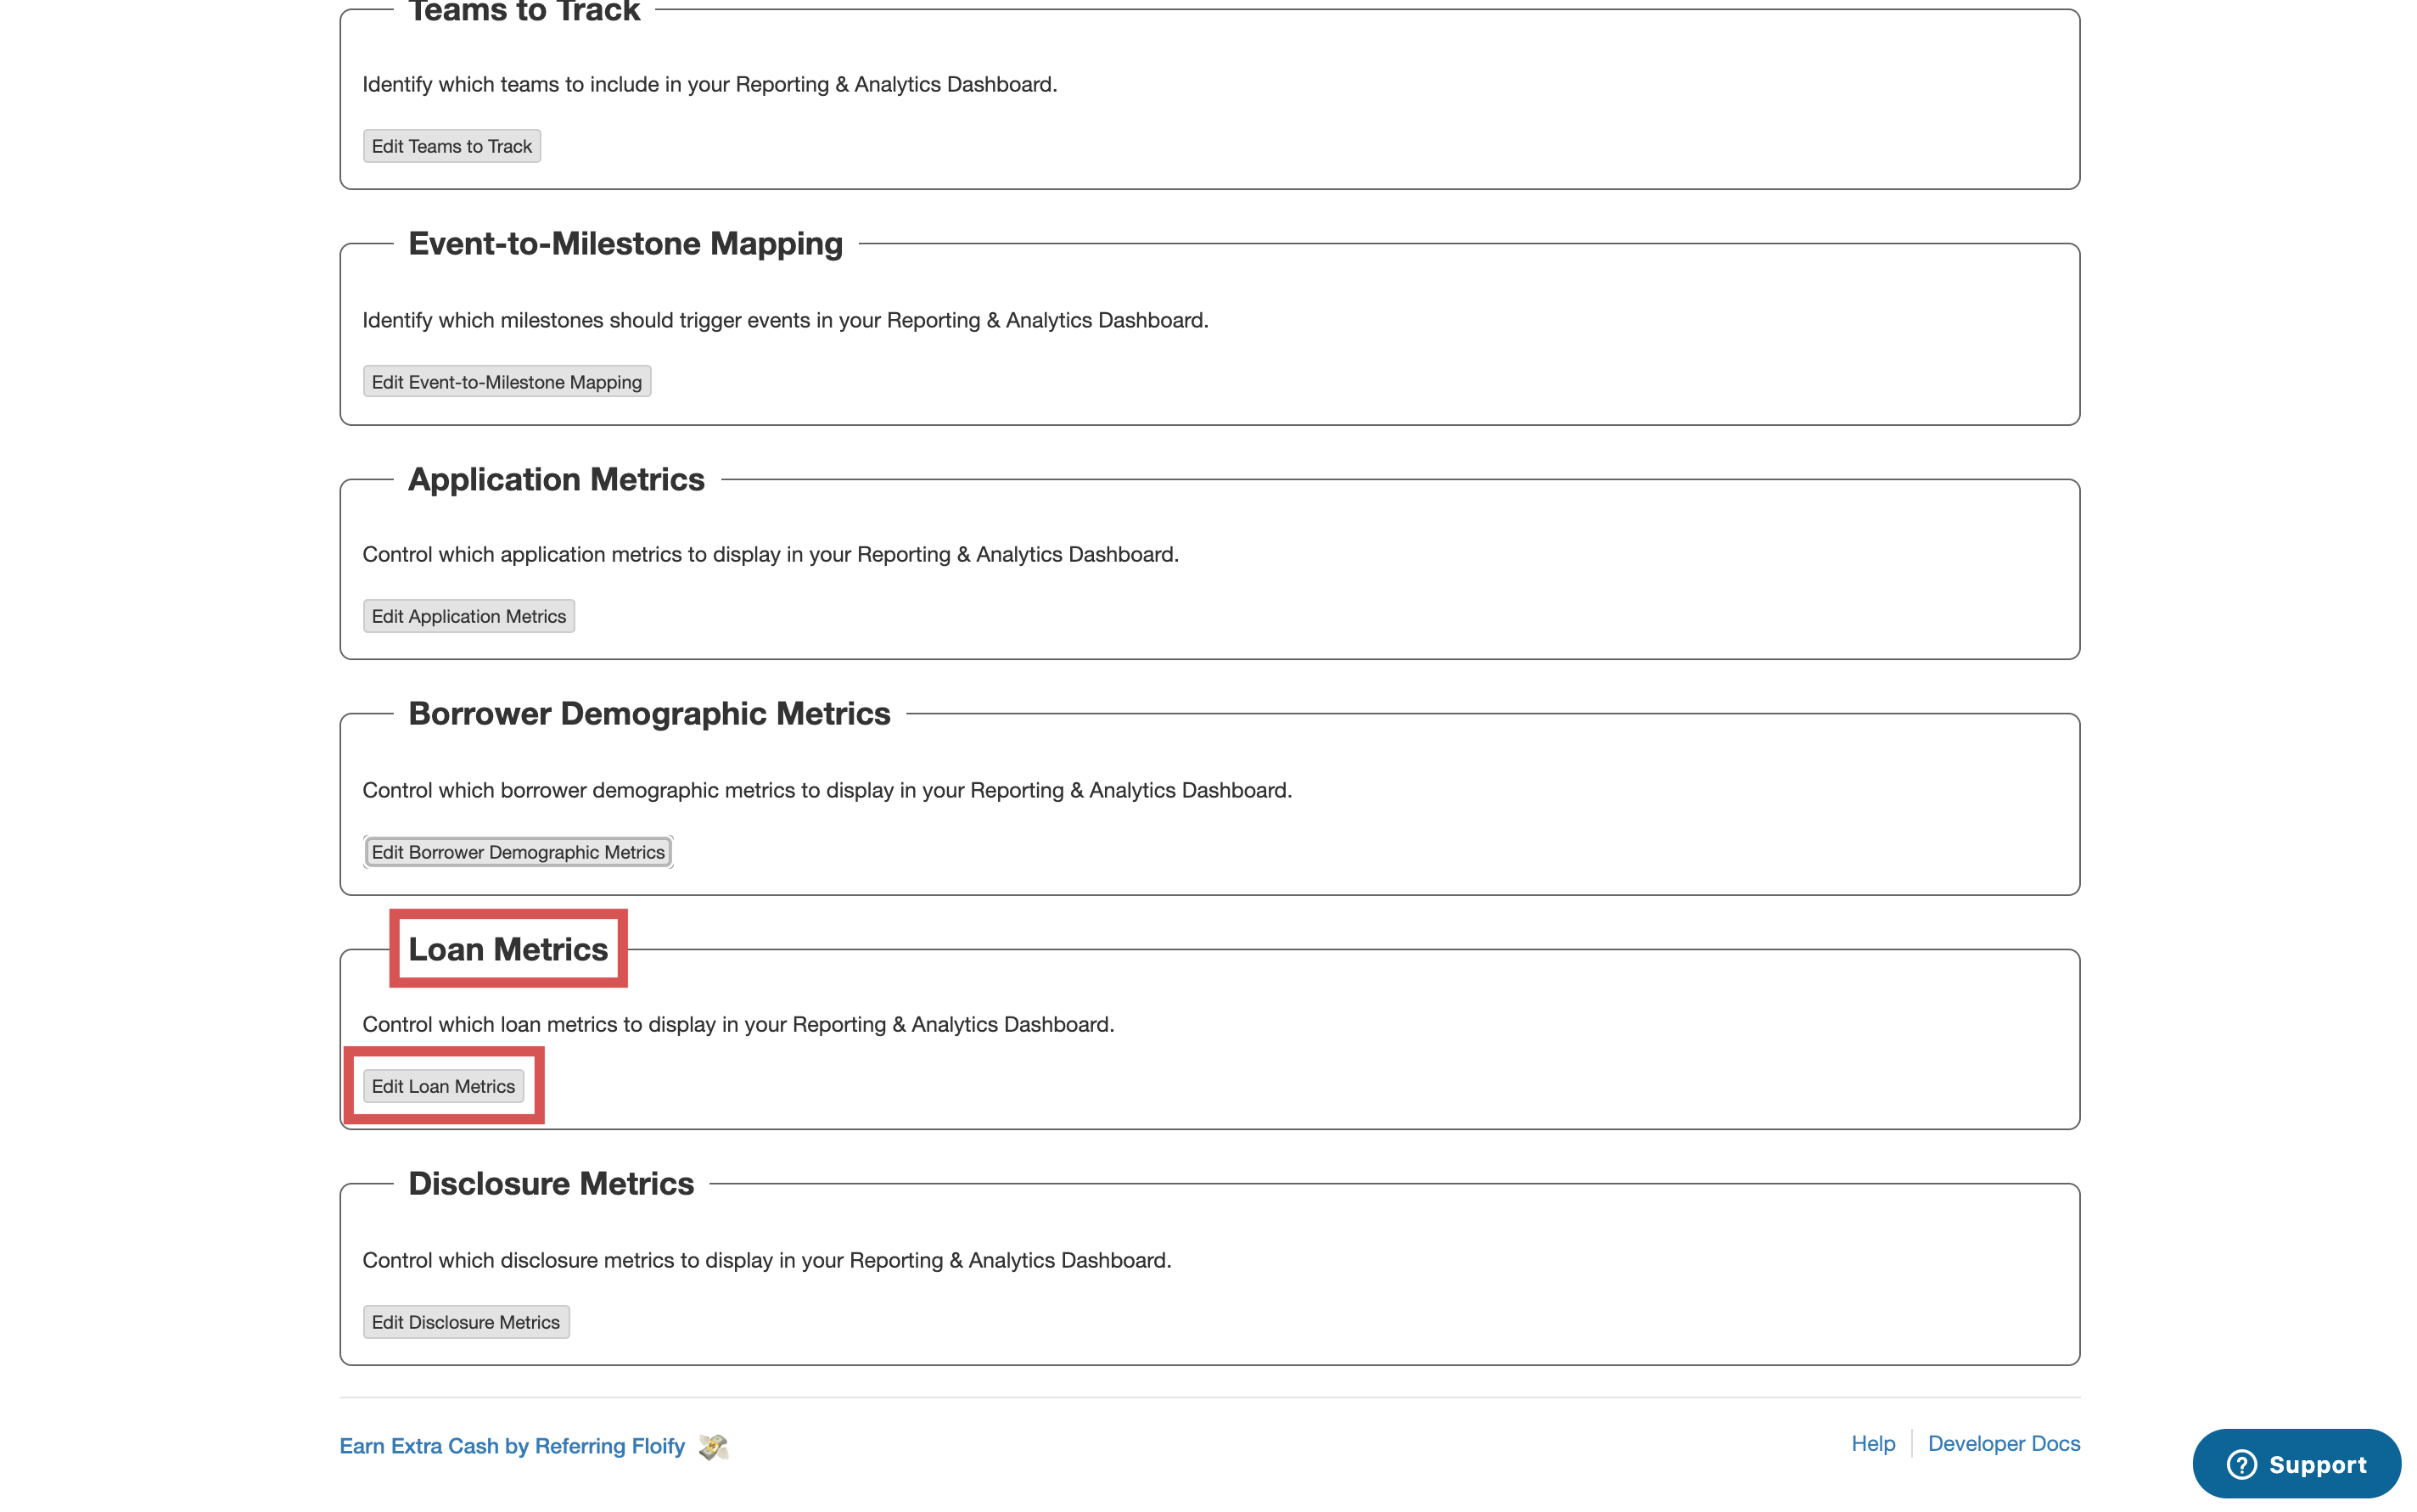
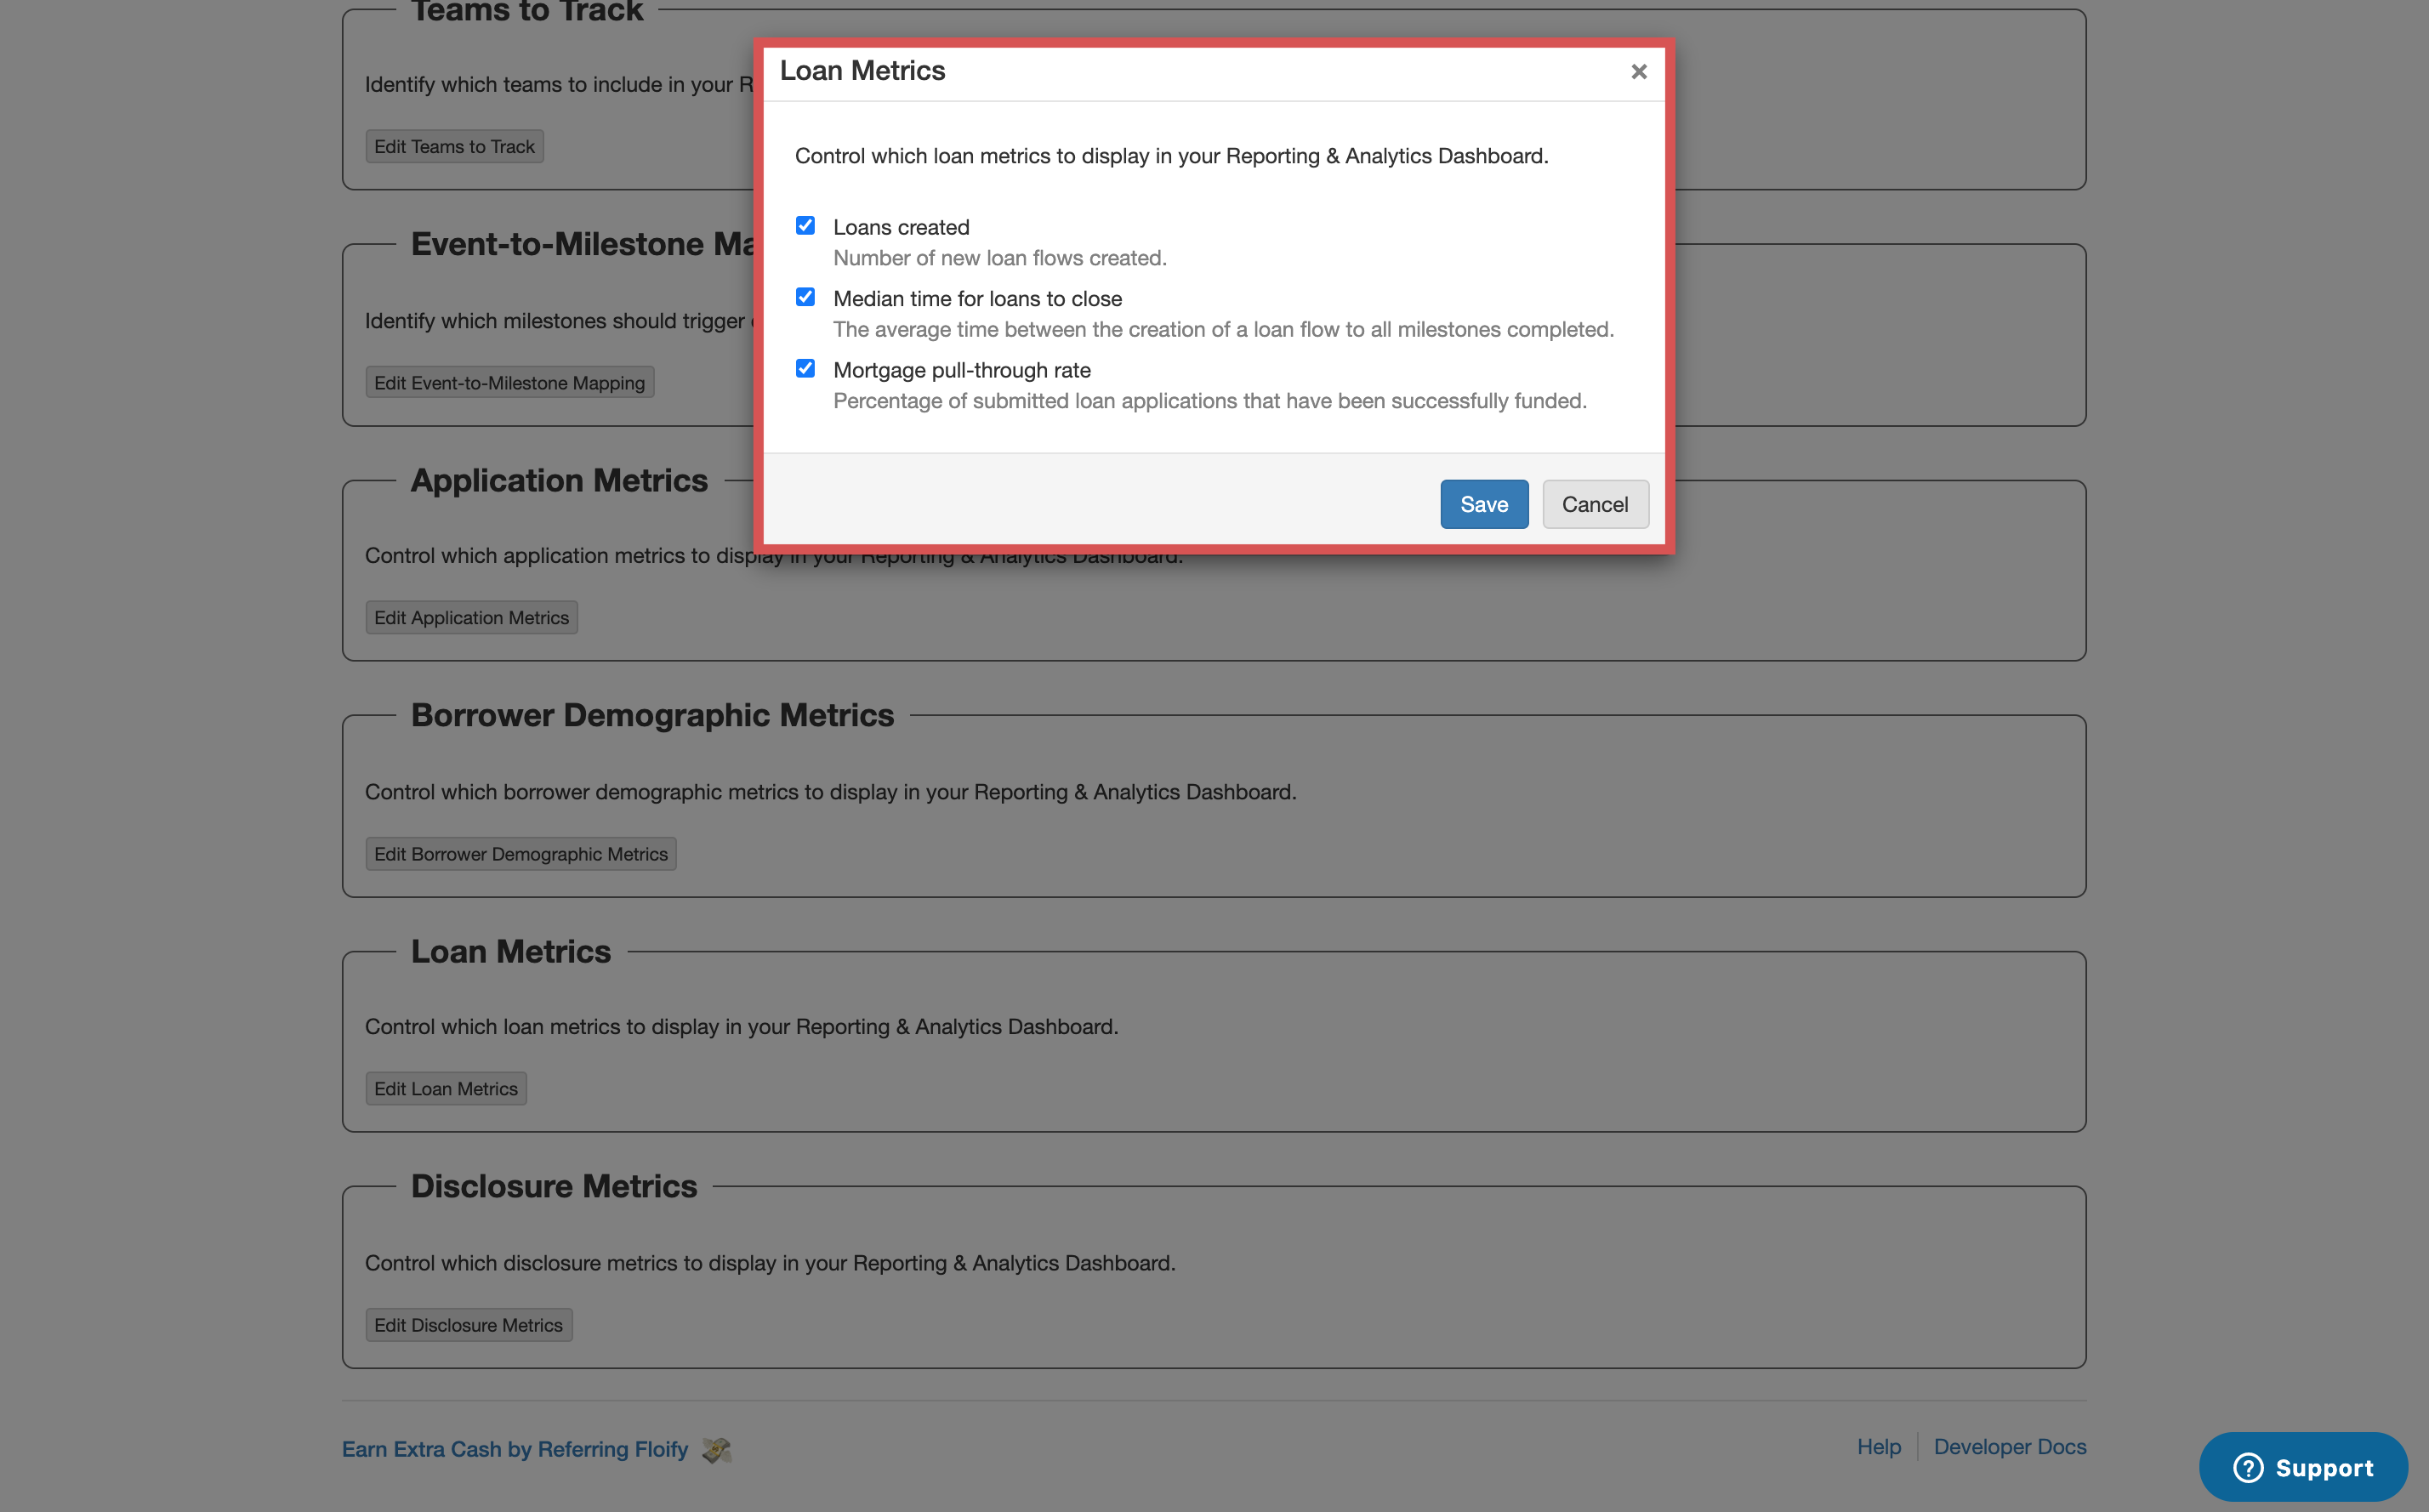
To control which loan metrics display in your dashboard, select Loan Metrics and then the option to Edit Loan Metrics:
Select the metrics you'd like displayed. Make sure you select Save to confirm the changes:
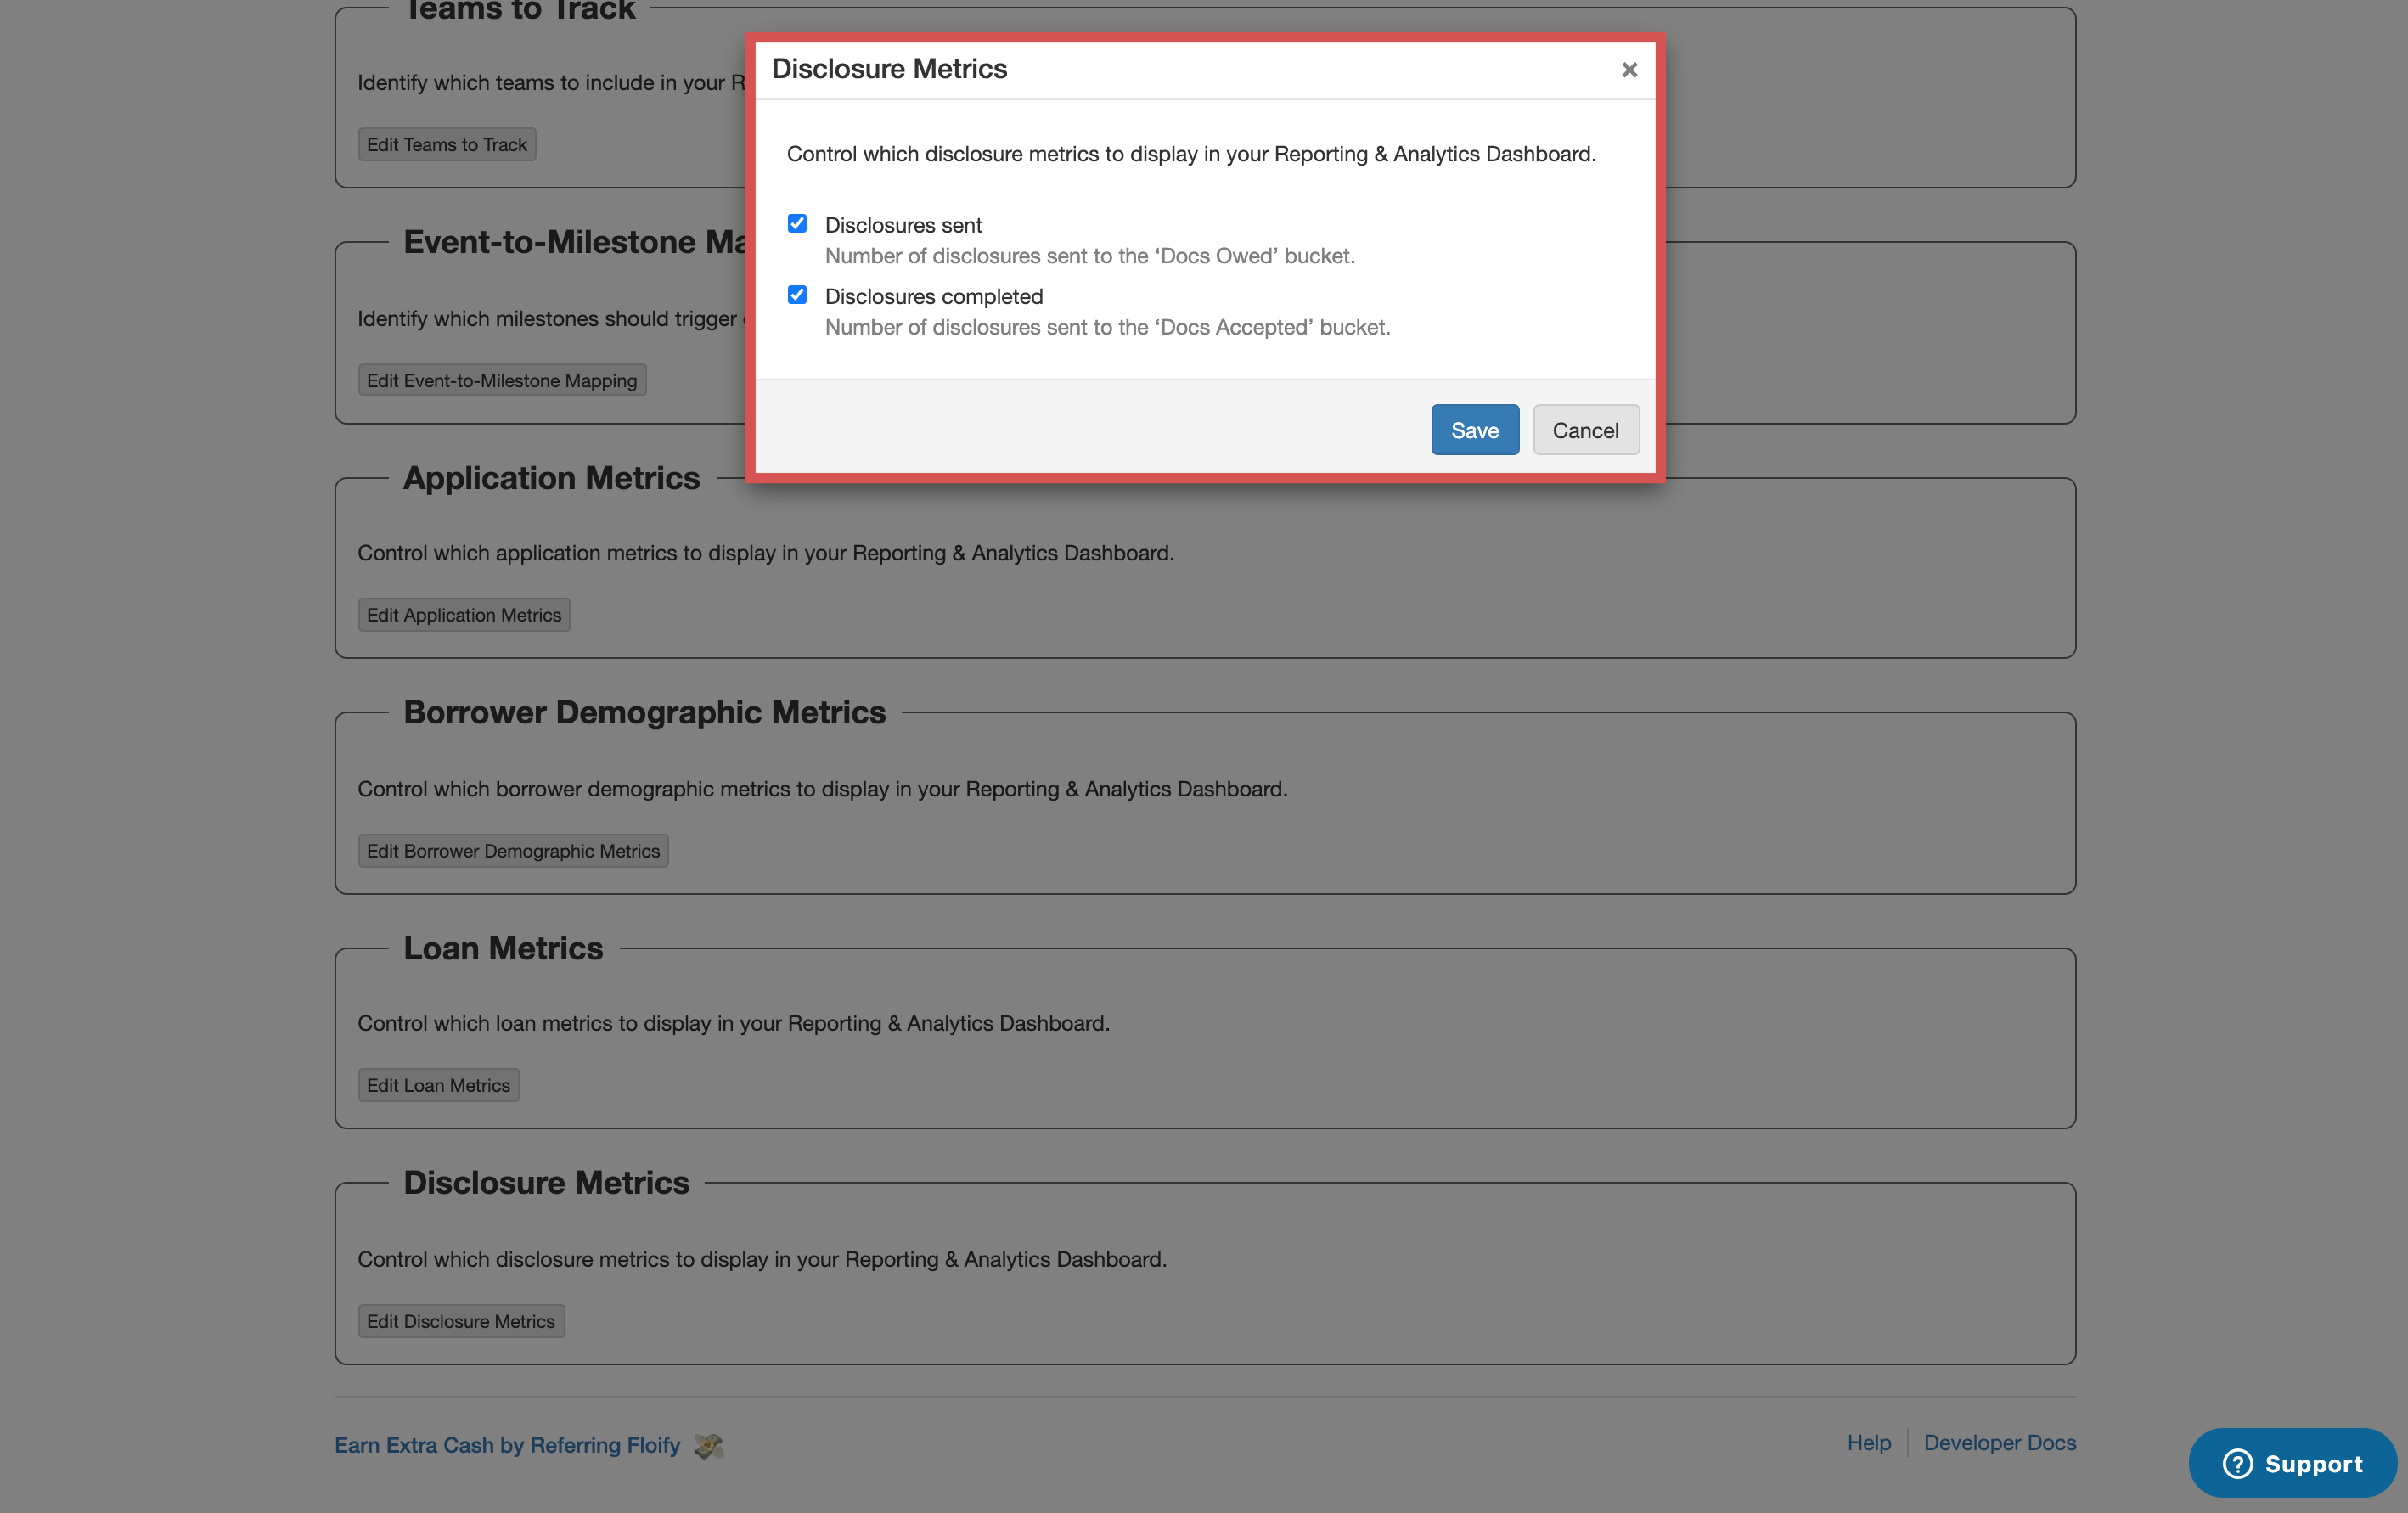
To control which loan metrics display in your dashboard, select Loan Metrics and then the option to Edit Loan Metrics:
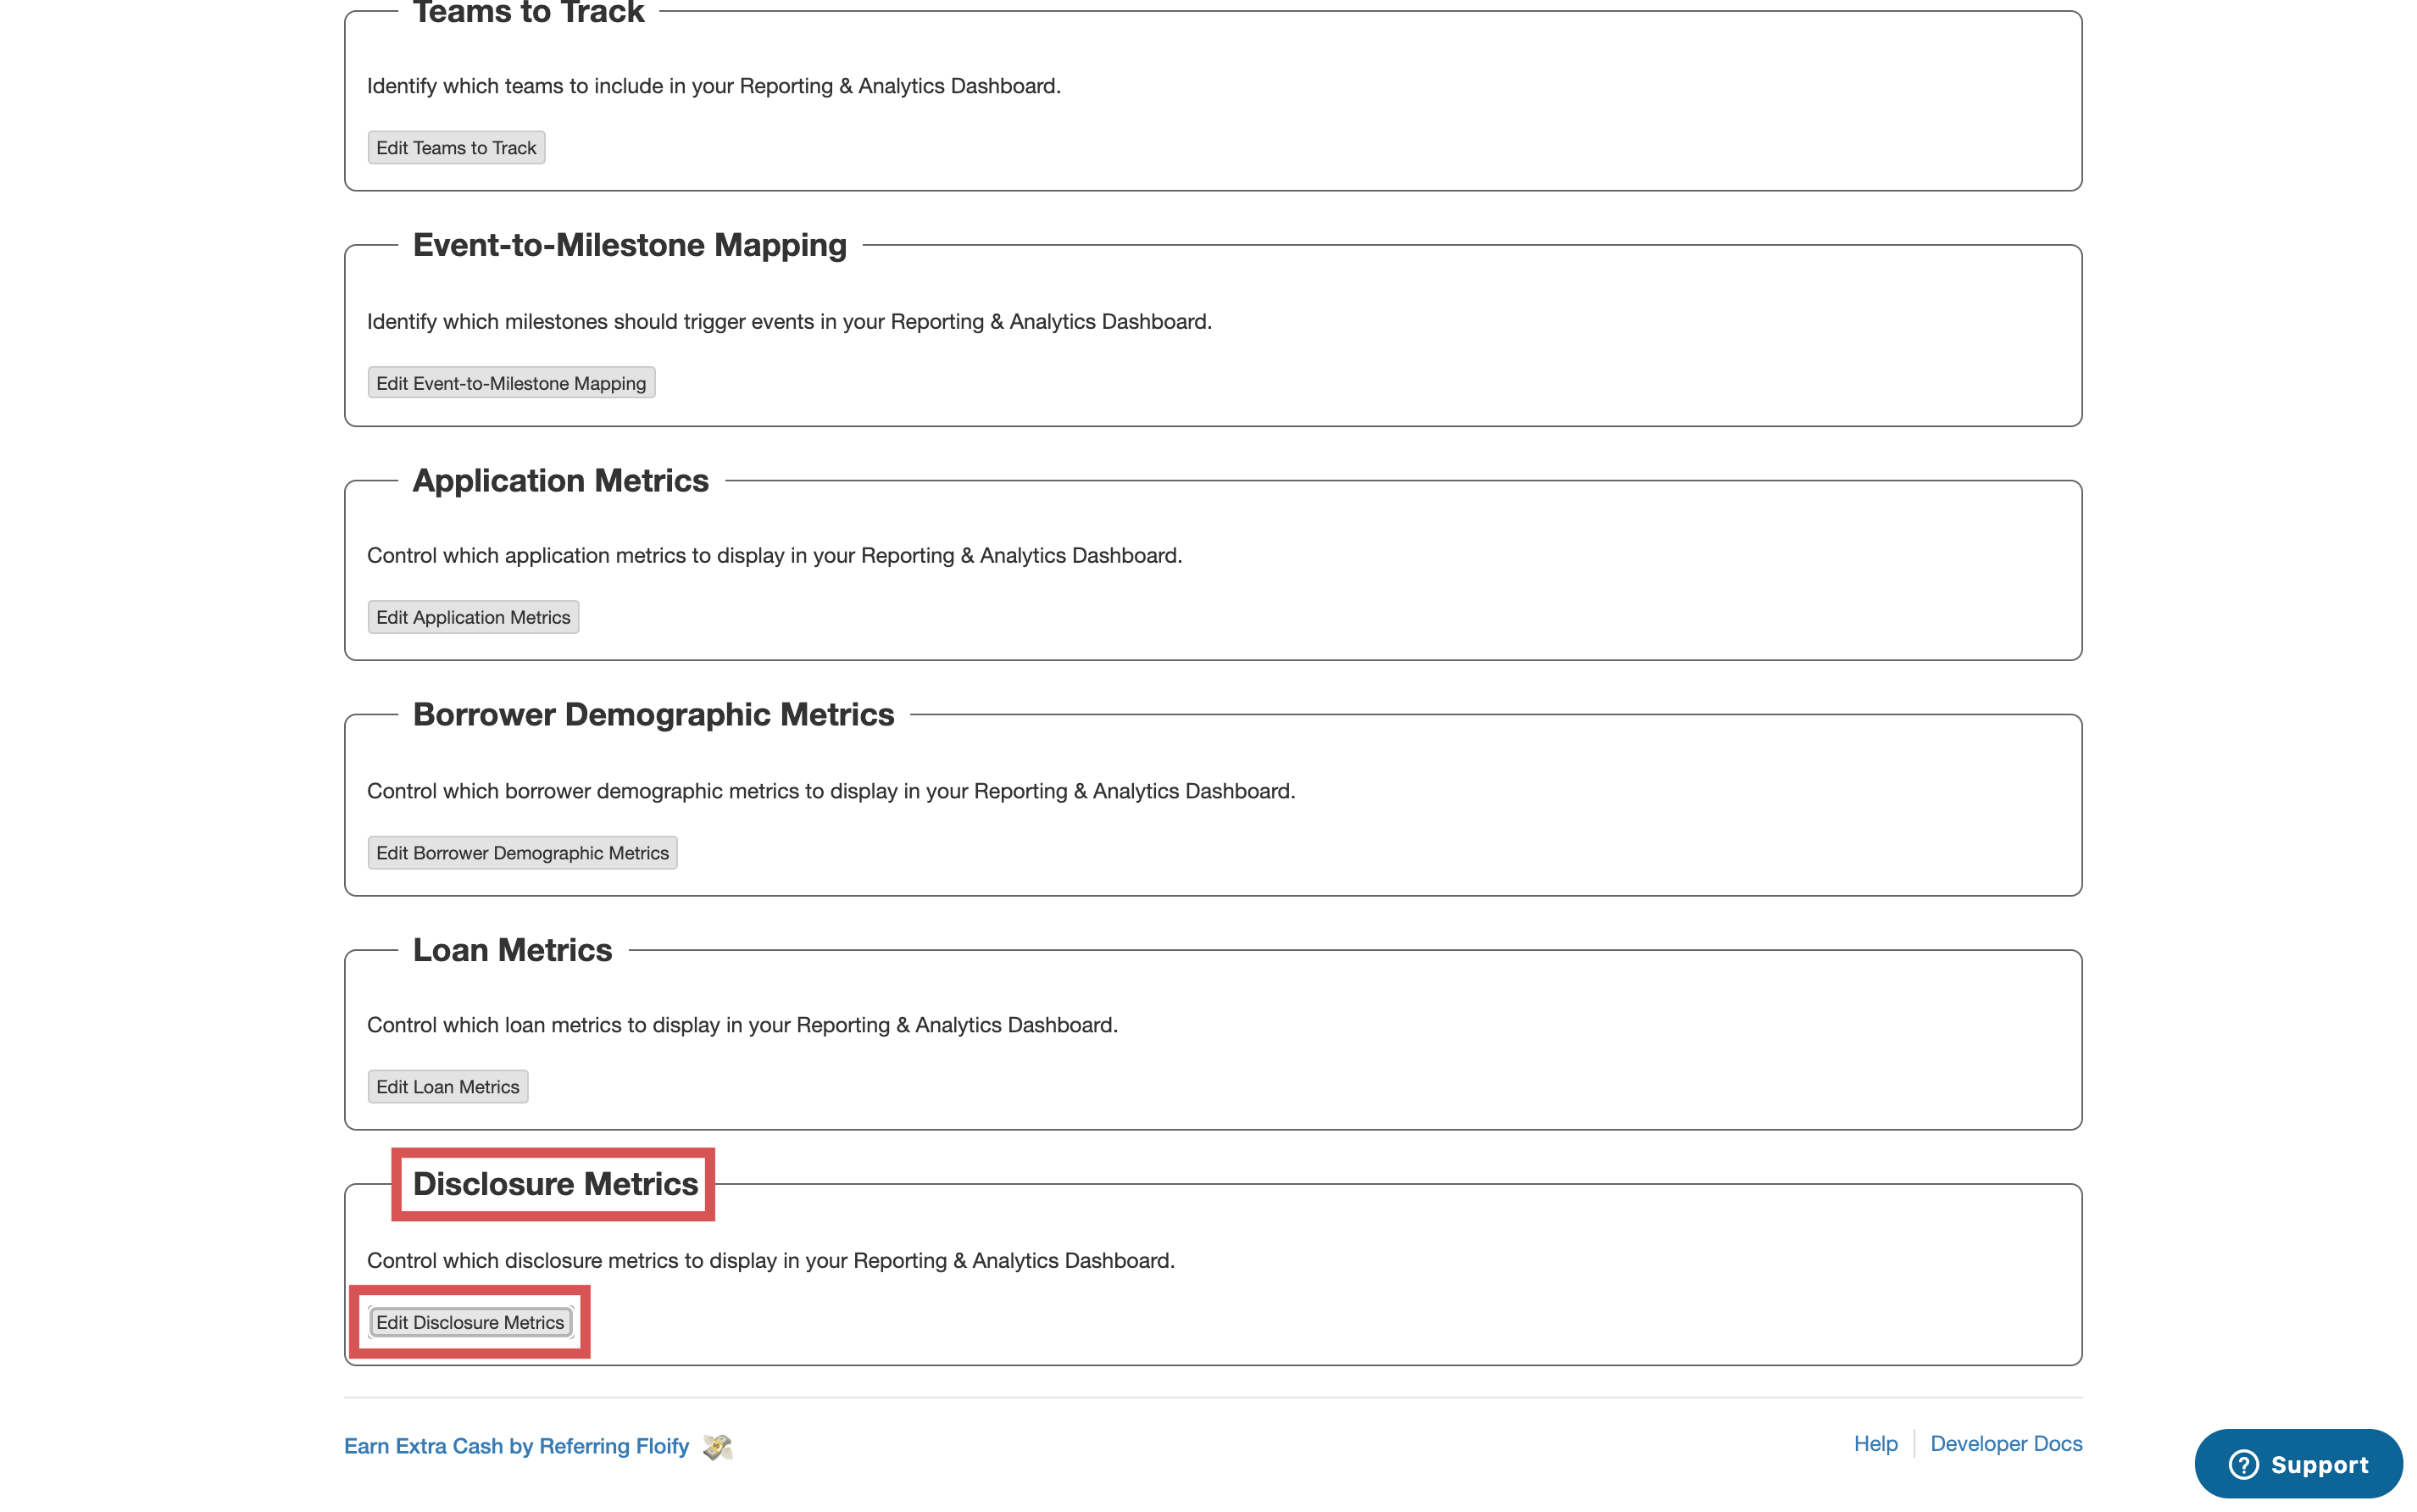
Select the metrics you'd like displayed. Make sure you select Save to confirm the changes:
Once everything is configured the way you like, you can access the Reporting and Analytics Dashboard to view the data. For more information regarding accessing the dashboard, visit this help article: Use the Reporting and Analytics Dashboard to View Data for LO Teams.
Please sign in to leave a comment.